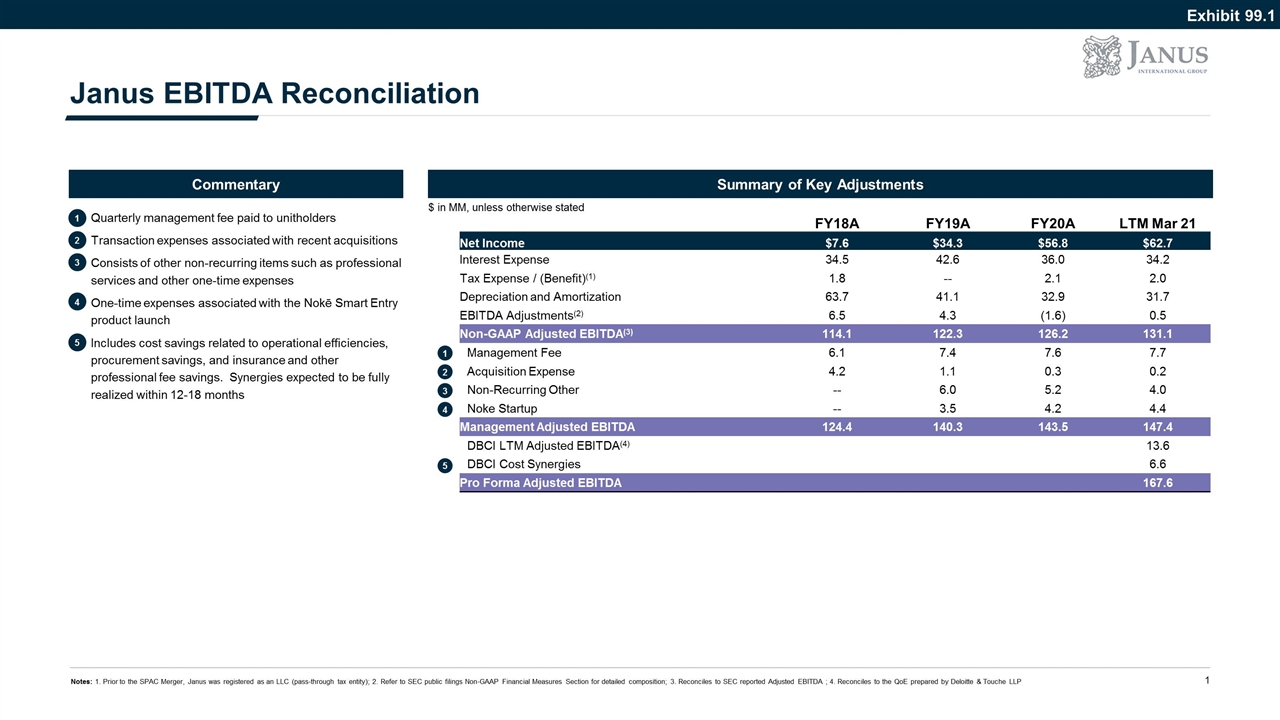

FY18A FY19A FY20A LTM Mar 21 Net Income $7.6 $34.3 $56.8 $62.7 Interest Expense 34.5 42.6 36.0 34.2 Tax Expense / (Benefit)(1) 1.8 -- 2.1 2.0 Depreciation and Amortization 63.7 41.1 32.9 31.7 EBITDA Adjustments(2) 6.5 4.3 (1.6) 0.5 Non-GAAP Adjusted EBITDA(3) 114.1 122.3 126.2 131.1 Management Fee 6.1 7.4 7.6 7.7 Acquisition Expense 4.2 1.1 0.3 0.2 Non-Recurring Other -- 6.0 5.2 4.0 Noke Startup -- 3.5 4.2 4.4 Management Adjusted EBITDA 124.4 140.3 143.5 147.4 DBCI LTM Adjusted EBITDA(4) 13.6 DBCI Cost Synergies 6.6 Pro Forma Adjusted EBITDA 167.6 Additional Company Materials Janus EBITDA Reconciliation Commentary Summary of Key Adjustments $ in MM, unless otherwise stated Quarterly management fee paid to unitholders Transaction expenses associated with recent acquisitions Consists of other non-recurring items such as professional services and other one-time expenses One-time expenses associated with the Nokē Smart Entry product launch Includes cost savings related to operational efficiencies, procurement savings, and insurance and other professional fee savings. Synergies expected to be fully realized within 12-18 months 1 2 3 4 1 2 3 4 5 Notes: 1. Prior to the SPAC Merger, Janus was registered as an LLC (pass-through tax entity); 2. Refer to SEC public filings Non-GAAP Financial Measures Section for detailed composition; 3. Reconciles to SEC reported Adjusted EBITDA ; 4. Reconciles to the QoE prepared by Deloitte & Touche LLP 5 Exhibit 99.1