

FOURTH QUARTER AND FULL YEAR 2021 EARNINGS PRESENTATION MARCH 15, 2022 Exhibit 99.2

FORWARD LOOKING STATEMENTS Certain statements in this communication, including the estimated guidance provided under “2022 Outlook” herein, may be considered “forward-looking statements” within the meaning of Section 27A of the Securities Act of 1933, as amended, and Section 21E of the Securities Exchange Act of 1934, as amended. All statements other than statements of historical fact included in this communication are forward-looking statements, including, but not limited to statements regarding Janus’s belief regarding the demand outlook for Janus’s products and the strength of the industrials markets. When used in this communication, words such as “may,” “should,” “could,” “would,” “expect,” “plan,” “anticipate,” “believe,” “estimate,” “continue,” or the negative of such terms or other similar expressions, as they relate to the management team, identify forward-looking statements. Such forward-looking statements are based on the current beliefs of Janus’s management, based on currently available information, as to the outcome and timing of future events, and involve factors, risks, and uncertainties that may cause actual results in future periods to differ materially from such statements. In addition to factors previously disclosed in Janus’s reports filed with the SEC and those identified elsewhere in this communication, the following factors, among others, could cause actual results to differ materially from forward-looking statements or historical performance: (i) risks of the self-storage industry; (ii) the highly competitive nature of the self-storage industry and Janus’s ability to compete therein; (iii) litigation, complaints, and/or adverse publicity; (iv) cyber incidents or directed attacks that could result in information theft, data corruption, operational disruption and/or financial loss; and (v) the risk that the demand outlook for Janus’s products may not be as strong as anticipated. There can be no assurance that the events, results, trends or guidance regarding financial outlook identified in these forward-looking statements will occur or be achieved. Forward-looking statements speak only as of the date they are made, and Janus is not under any obligation and expressly disclaims any obligation, to update, alter or otherwise revise any forward-looking statement, whether as a result of new information, future events or otherwise, except as required by law. This communication is not intended to be all-inclusive or to contain all the information that a person may desire in considering an investment in Janus and is not intended to form the basis of an investment decision in Janus. All subsequent written and oral forward-looking statements concerning Janus or other matters and attributable to Janus or any person acting on its behalf are expressly qualified in their entirety by the cautionary statements above and under the heading “Risk Factors” in Janus’s most recently filed Annual Report on Form 10-K and Quarterly Report on Form 10-Q, as updated from time to time in amendments and its subsequent filings with the SEC.

AGENDA Business Overview Ramey Jackson Chief Executive Officer Financial Overview & Outlook Scott Sannes Chief Financial Officer
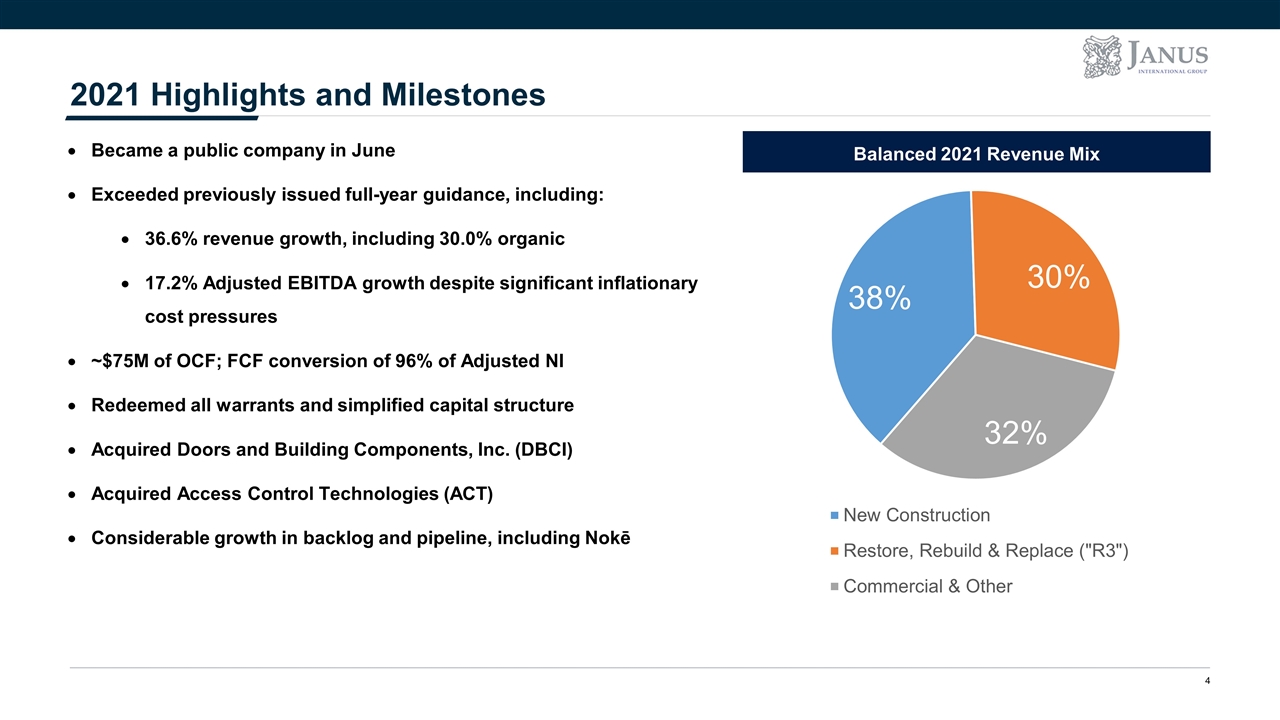
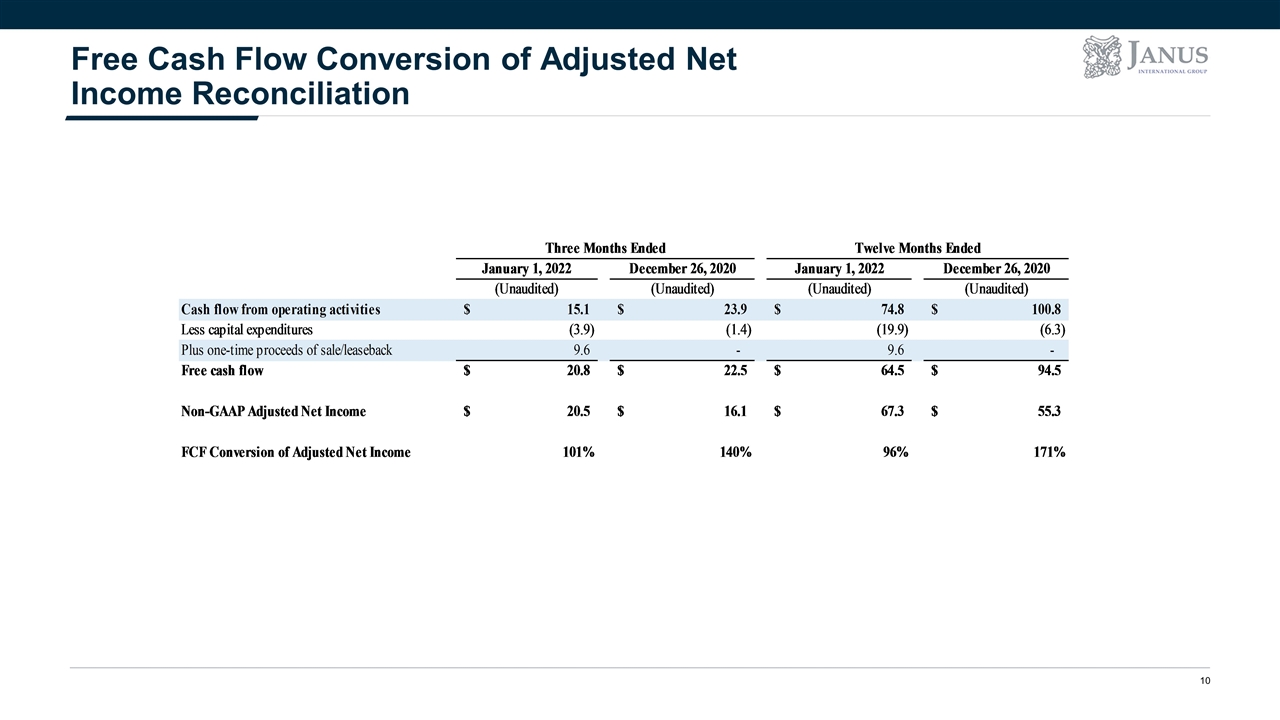
Section TBD 2021 Highlights and Milestones Became a public company in June Exceeded previously issued full-year guidance, including: 36.6% revenue growth, including 30.0% organic 17.2% Adjusted EBITDA growth despite significant inflationary cost pressures ~$75M of OCF; FCF conversion of 96% of Adjusted NI Redeemed all warrants and simplified capital structure Acquired Doors and Building Components, Inc. (DBCI) Acquired Access Control Technologies (ACT) Considerable growth in backlog and pipeline, including Nokē Balanced 2021 Revenue Mix

Section TBD Q4 2021 Results Overview Adj. EBITDA1 $43.3M 26.7% increase Revenue $235.4M 58.4% increase Adj. Net Income1 $20.5M 27.3% increase OCF $15.1M FCF2 = 101% of Adj. NI Adjusted EBITDA and Adjusted Net Income are not financial measures determined in accordance with GAAP. For a definition of these metrics and a reconciliation to our most directly comparable financial measure calculated and presented in accordance with GAAP, please see the company’s latest filings with the SEC. FCF as reconciled in the appendix and includes one time proceeds of sale/leaseback transaction in December 2021. Continued Strong Growth and Execution
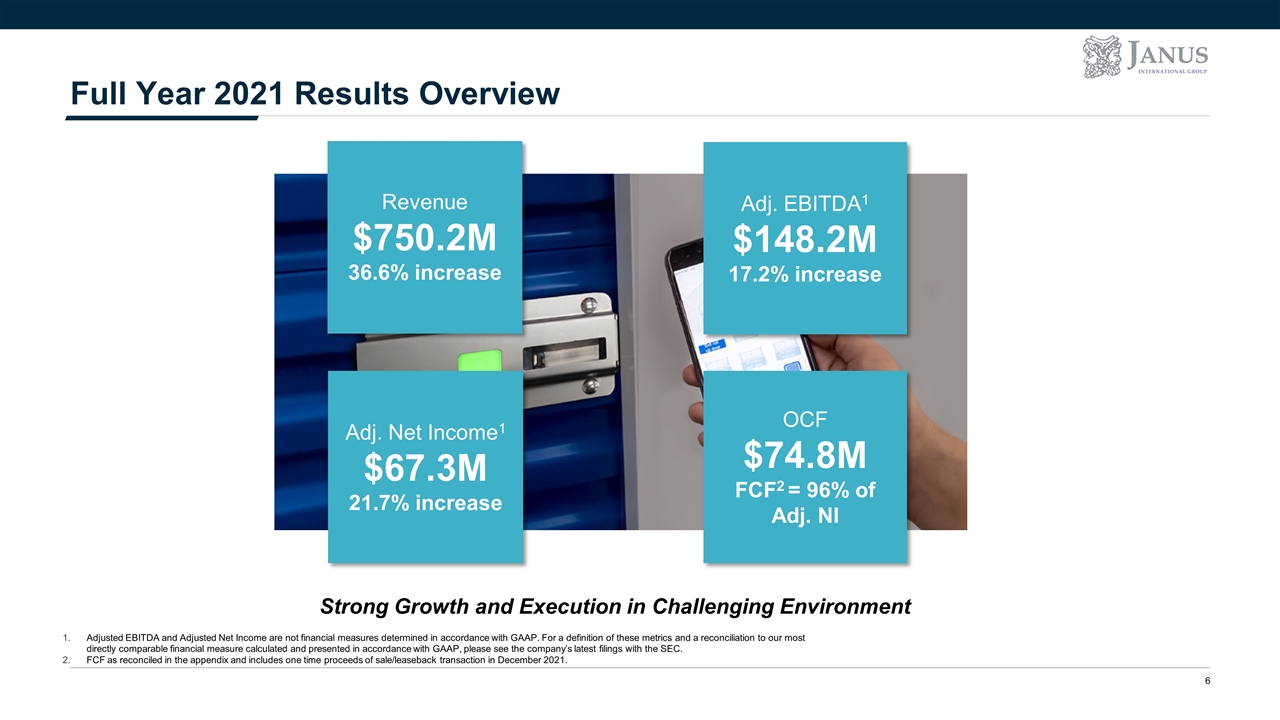
Section TBD Full Year 2021 Results Overview Adj. EBITDA1 $148.2M 17.2% increase Revenue $750.2M 36.6% increase Adj. Net Income1 $67.3M 21.7% increase OCF $74.8M FCF2 = 96% of Adj. NI Adjusted EBITDA and Adjusted Net Income are not financial measures determined in accordance with GAAP. For a definition of these metrics and a reconciliation to our most directly comparable financial measure calculated and presented in accordance with GAAP, please see the company’s latest filings with the SEC. FCF as reconciled in the appendix and includes one time proceeds of sale/leaseback transaction in December 2021. Strong Growth and Execution in Challenging Environment

Section TBD 2022 Outlook FULL YEAR FY 2022 GUIDANCE Revenue $845 to $865 million 14.0% increase at midpoint Adjusted EBITDA $183 to $190 million 15.5% increase at midpoint Attractive Growth and Adjusted EBITDA Margin Expansion
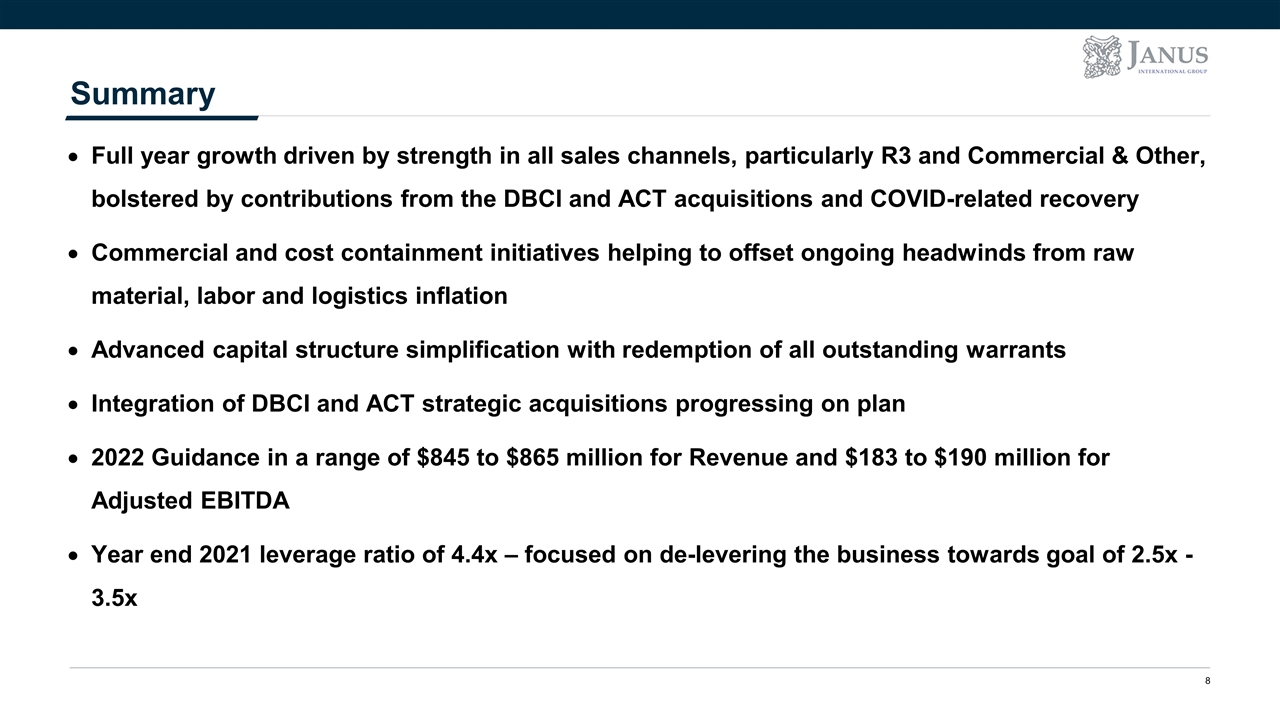
Section TBD Summary Full year growth driven by strength in all sales channels, particularly R3 and Commercial & Other, bolstered by contributions from the DBCI and ACT acquisitions and COVID-related recovery Commercial and cost containment initiatives helping to offset ongoing headwinds from raw material, labor and logistics inflation Advanced capital structure simplification with redemption of all outstanding warrants Integration of DBCI and ACT strategic acquisitions progressing on plan 2022 Guidance in a range of $845 to $865 million for Revenue and $183 to $190 million for Adjusted EBITDA Year end 2021 leverage ratio of 4.4x – focused on de-levering the business towards goal of 2.5x - 3.5x
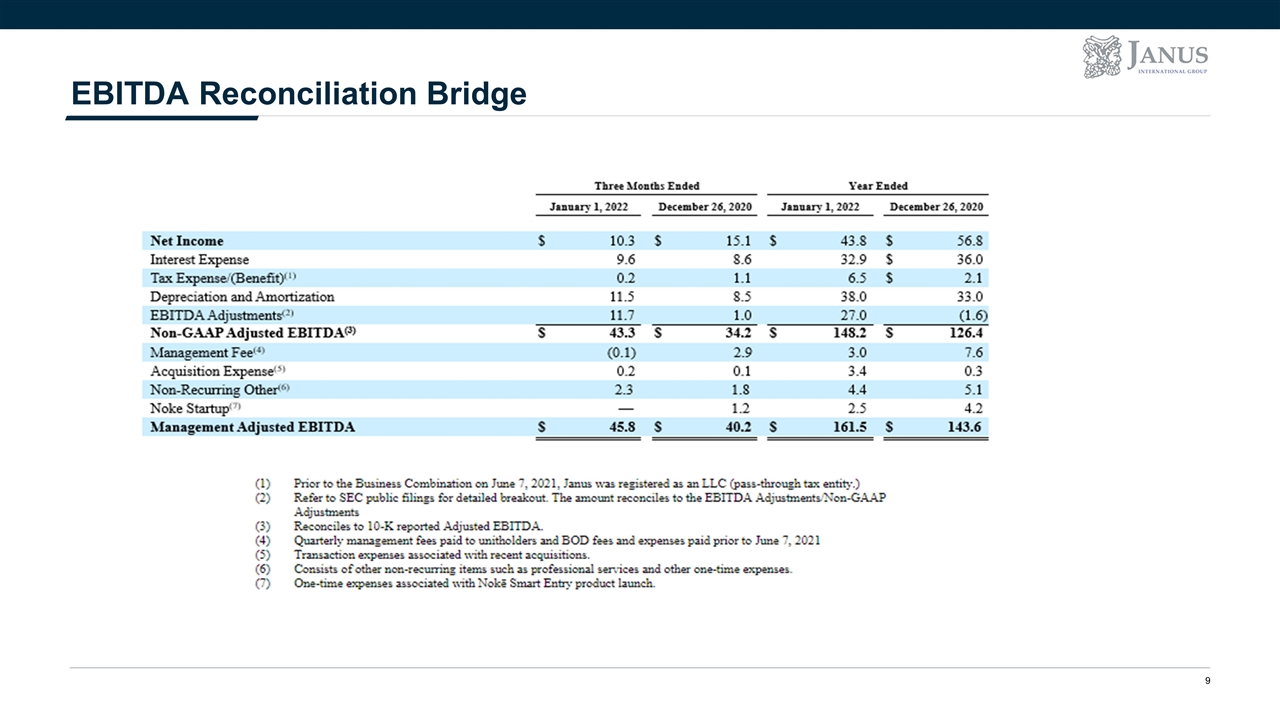
Section TBD EBITDA Reconciliation Bridge
Section TBD Free Cash Flow Conversion of Adjusted Net Income Reconciliation