Investor Presentation March 2022 1
Use of Projections and Financial Information and Forward-Looking Statements Certain statements in this communication, including the estimated guidance provided under “Financial Performance” herein, may be considered “forward-looking statements” within the meaning of Section 27A of the Securities Act of 1933, as amended, and Section 21E of the Securities Exchange Act of 1934, as amended. All statements other than statements of historical fact included in this communication are forward-looking statements, including, but not limited to statements regarding Janus International Group, Inc.’s (“Janus”) positioning in the industry to strengthen its pipeline and deliver on its objectives and Janus’ belief regarding the demand outlook for Janus’ products and the strength of the industrials markets. When used in this communication, words such as “may,” “should,” “could,” “would,” “expect,” “plan,” “anticipate,” “believe,” “estimate,” “continue,” or the negative of such terms or other similar expressions, as they relate to the management team, identify forward-looking statements. Such forward-looking statements are based on the current beliefs of Janus’ management, based on currently available information, as to the outcome and timing of future events, and involve factors, risks, and uncertainties that may cause actual results in future periods to differ materially from such statements. In addition to factors previously disclosed in Janus’ reports filed with the Securities and Exchange Commission (“SEC”) and those identified elsewhere in this communication, the following factors, among others, could cause actual results to differ materially from forward-looking statements or historical performance: (i) risks of the self-storage industry; (ii) the highly competitive nature of the self-storage industry and Janus’ ability to compete therein; and (iii) the risk that the demand outlook for Janus’ products may not be as strong as anticipated. There can be no assurance that the events, results, trends or guidance regarding financial outlook identified in these forward-looking statements will occur or be achieved. Forward-looking statements speak only as of the date they are made, and Janus is not under any obligation and expressly disclaims any obligation, to update, alter or otherwise revise any forward-looking statement, whether as a result of new information, future events or otherwise, except as required by law. This communication is not intended to be all-inclusive or to contain all the information that a person may desire in considering an investment in Janus and is not intended to form the basis of an investment decision in Janus. All subsequent written and oral forward-looking statements concerning Janus or other matters and attributable to Janus or any person acting on its behalf are expressly qualified in their entirety by the cautionary statements above as well as any risks or uncertainties discussed in our filings with the SEC, including without limitation, under the heading “Risk Factors” in Janus’ registration statement on Form S-4 initially filed with the SEC on February 8, 2021, as amended, registration statement on Form S-1, initially filed with the SEC on July 7, 2021, as amended, most recently filed Quarterly Report on Form 10-Q and its subsequent filings with the SEC. The recipient of this presentation acknowledges that it is (a) aware that United States securities laws prohibit any person who has material, non-public information concerning a company from purchasing and selling securities of such company or from communicating such information to any other person under circumstances in which it is reasonably foreseeable that such person may purchase or sell such securities and (b) that the recipient will neither use, nor cause any third party to use this investor presentation or any information contained herein in violation of the Securities Exchange Act of 1934, as amended, including, without limitation, Rule 10b-5 thereunder. Financial Information Janus uses measures of performance that are not required by or presented in accordance with generally accepted accounting principles in the United States of America (“GAAP”). Non-GAAP financial performance measures are used to supplement the financial information presented on a GAAP basis. These non-GAAP financial measures should not be considered in isolation or as a substitute for the relevant GAAP measures and should be read in conjunction with information presented on a GAAP basis. Management Adjusted EBITDA is a non-GAAP financial measure used by Janus to evaluate its operating performance, generate future operating plans, and make strategic decisions, including those relating to operating expenses and the allocation of internal resources. Accordingly, Janus believes Management Adjusted EBITDA provides useful information to investors and others in understanding and evaluating Janus’ operating results in the same manner as its management and board of directors and in comparison with Janus’ peer group companies. In addition, Management Adjusted EBITDA provides useful measures for period-to-period comparisons of Janus’ business, as they remove the effect of certain non- recurring events and other non-recurring charges, such as acquisitions, and certain variable or non-recurring charges. Management Adjusted EBITDA is defined as net income excluding interest expense, income taxes, depreciation expense, amortization, sponsor management fees, acquisition expenses, Nokē-related startup costs, and other non-operational, non-recurring items. Management Adjusted EBITDA should not be considered in isolation of, or as an alternative to, measures prepared in accordance with GAAP. There are a number of limitations related to the use of Management Adjusted EBITDA rather than net income (loss), which is the nearest GAAP equivalent of Management Adjusted EBITDA. These limitations include that the non-GAAP financial measures: exclude depreciation and amortization, and although these are non-cash expenses, the assets being depreciated may be replaced in the future; do not reflect interest expense, or the cash requirements necessary to service interest on debt, which reduces cash available; do not reflect the provision for or benefit from income tax that may result in payments that reduce cash available; exclude non-recurring items (i.e., the extinguishment of debt); and may not be comparable to similar non-GAAP financial measures used by other companies, because the expenses and other items that Janus excludes in the calculation of these non-GAAP financial measures may differ from the expenses and other items, if any, that other companies may exclude from these non-GAAP financial measures when they report their operating results. Because of these limitations, these non-GAAP financial measures should be considered along with other operating and financial performance measures presented in accordance with GAAP. Disclaimer 2

Today’s Presenters ● Joined Janus in 2002 ● Seasoned self-storage executive with deep customer relationships ● Previously served as regional sales manager at DBCI and Atlas as well as VP of Sales & Marketing at Janus ● Established track record of achieving strategic growth Ramey Jackson Chief Executive Officer, Janus 20+ years experience ● Joined Janus in 2015 ● 20+ years of highly diverse, global business experience ● Previously served as CFO of Ajax (acquired by Fomas), Controls Southeast (acquired by Ametek), and Polyester Fibers Scott Sannes Chief Financial Officer, Janus 20+ years experience 3
We are a market leader in Custom Building Product Solutions and Access Control Technologies for the Self-Storage and Commercial Industrial markets 4
Agenda • Overview of Janus • Why We Win • Our Growth Strategy • Financial Performance 1 2 4 3 5
Overview of Janus 6
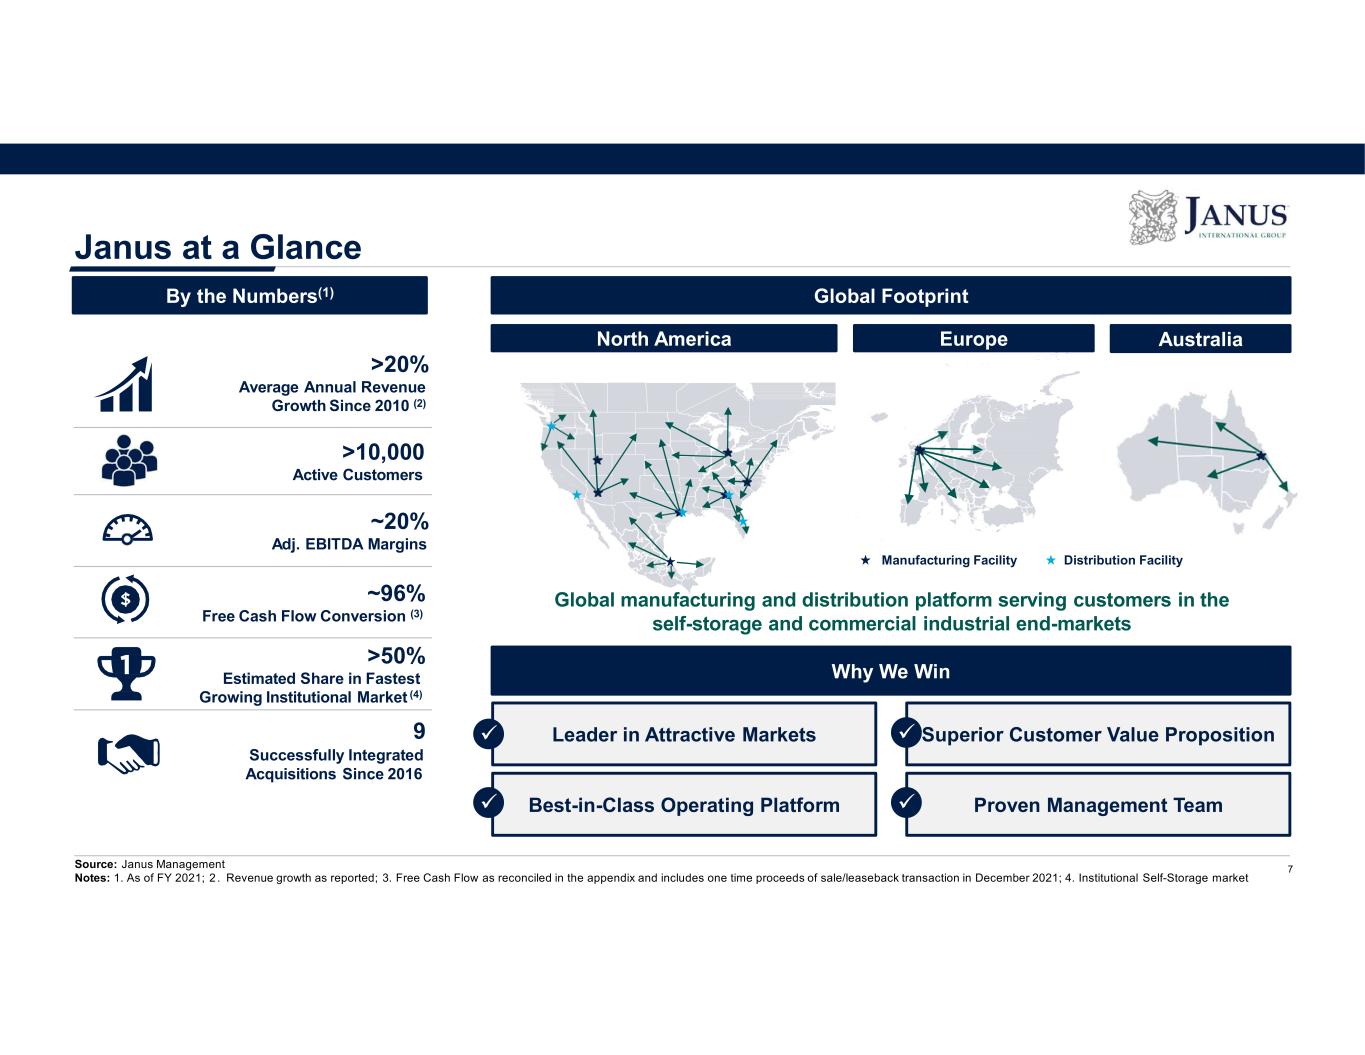
Proven Management TeamBest-in-Class Operating Platform Superior Customer Value PropositionLeader in Attractive Markets Janus at a Glance >20% Average Annual Revenue Growth Since 2010 (2) >10,000 Active Customers ~20% Adj. EBITDA Margins ~96% Free Cash Flow Conversion (3) >50% Estimated Share in Fastest Growing Institutional Market (4) 9 Successfully Integrated Acquisitions Since 2016 Source: Janus Management Notes: 1. As of FY 2021; 2 . Revenue growth as reported; 3. Free Cash Flow as reconciled in the appendix and includes one time proceeds of sale/leaseback transaction in December 2021; 4. Institutional Self-Storage market Global manufacturing and distribution platform serving customers in the self-storage and commercial industrial end-markets Why We Win By the Numbers(1) Global Footprint North America Europe Australia Manufacturing Facility 7 Distribution Facility
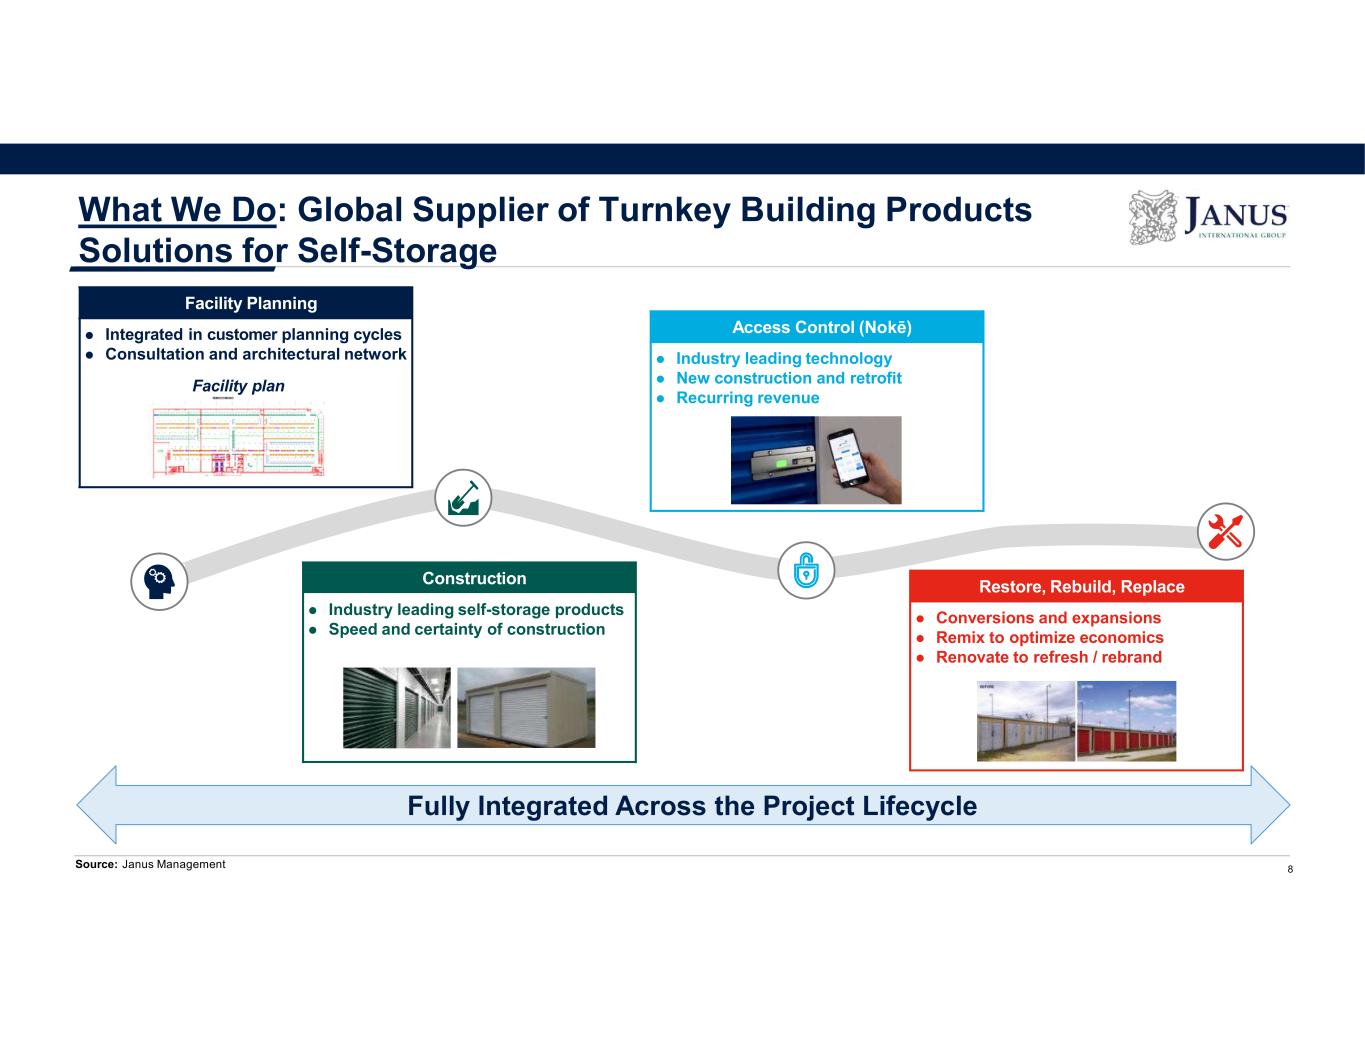
Access Control (Nokē) Industry leading technology New construction and retrofit Recurring revenue Restore, Rebuild, Replace Conversions and expansions Remix to optimize economics Renovate to refresh / rebrand Construction Industry leading self-storage products Speed and certainty of construction Facility Planning Integrated in customer planning cycles Consultation and architectural network Source: Janus Management What We Do: Global Supplier of Turnkey Building Products Solutions for Self-Storage Facility plan Fully Integrated Across the Project Lifecycle 8
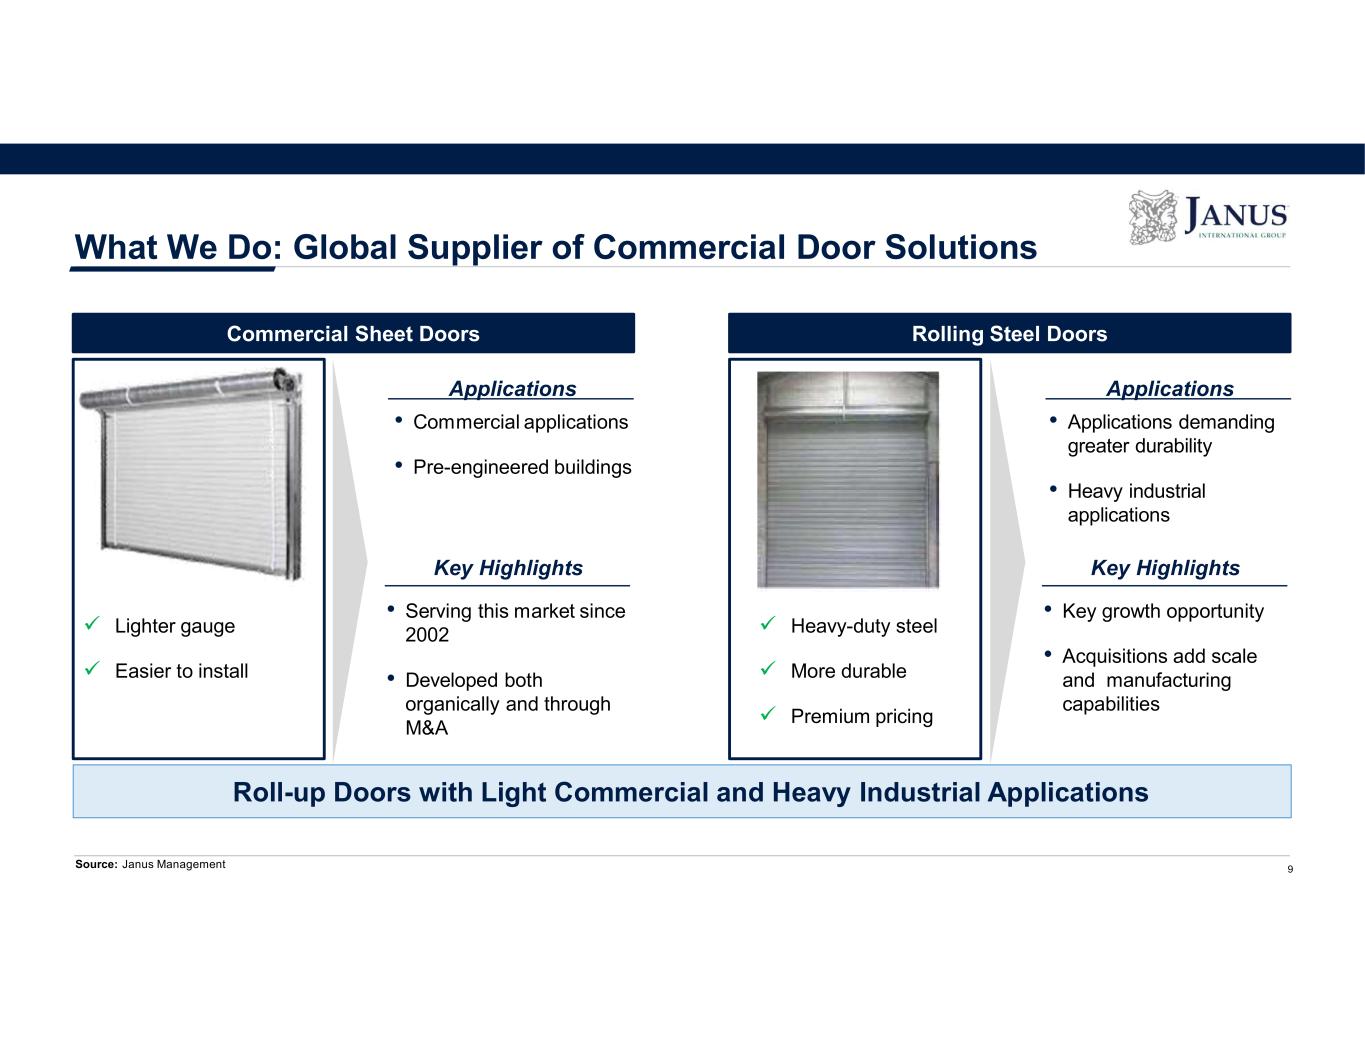
What We Do: Global Supplier of Commercial Door Solutions Source: Janus Management Rolling Steel Doors • Commercial applications • Pre-engineered buildings Applications • Serving this market since 2002 • Developed both organically and through M&A Key Highlights • Applications demanding greater durability • Heavy industrial applications • Key growth opportunity • Acquisitions add scale and manufacturing capabilities Roll-up Doors with Light Commercial and Heavy Industrial Applications Lighter gauge Easier to install Heavy-duty steel More durable Premium pricing 9 Commercial Sheet Doors Key Highlights Applications
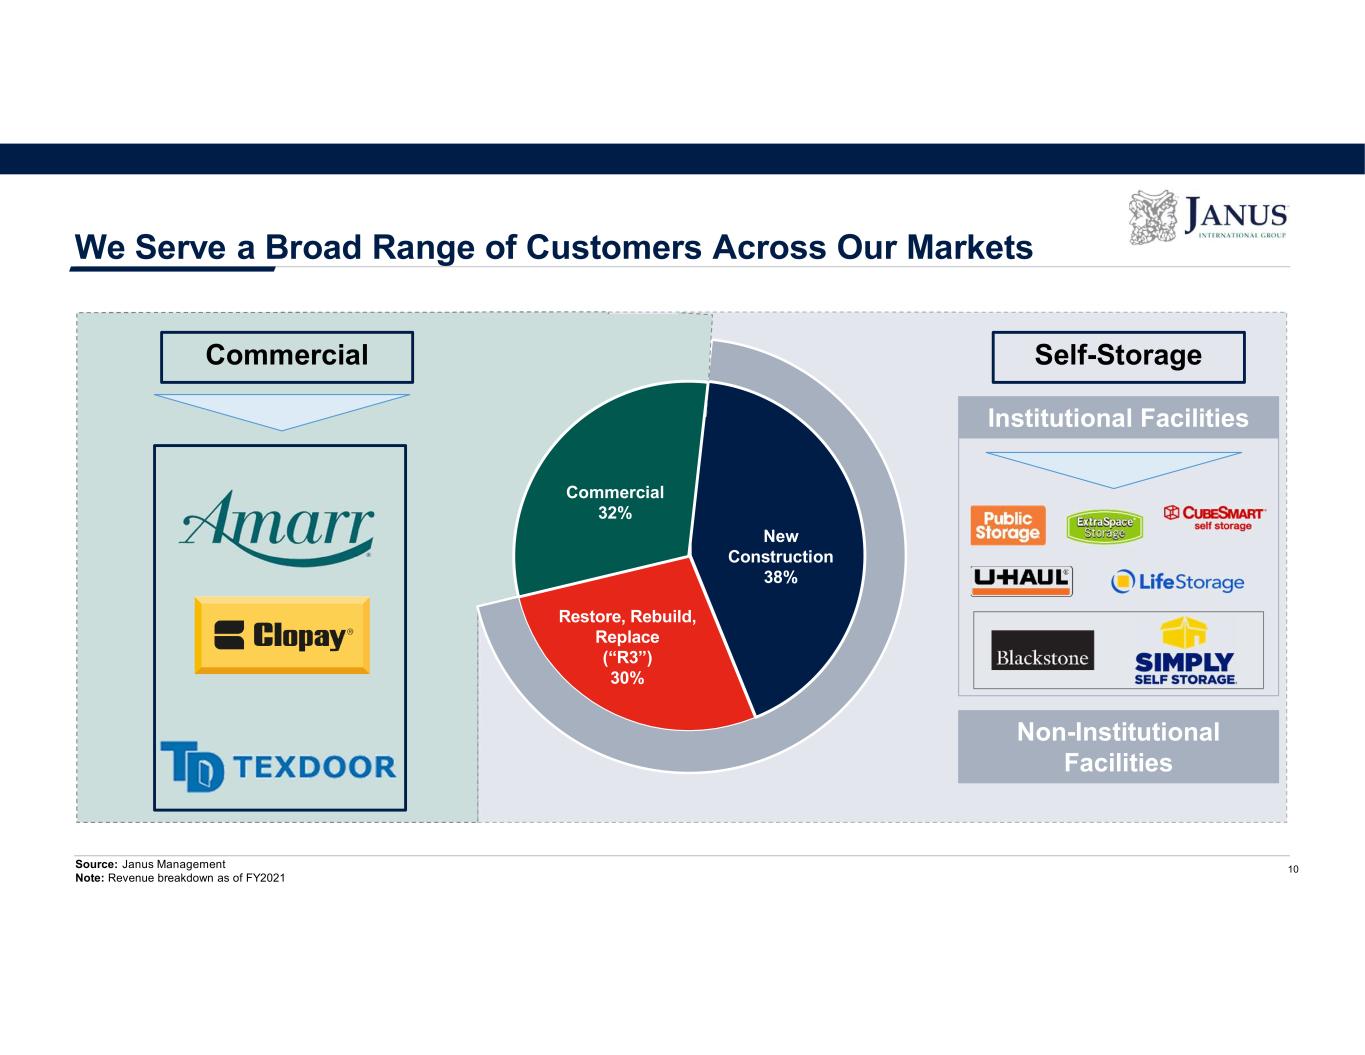
Self-Storage Institutional Facilities Non-Institutional Facilities We Serve a Broad Range of Customers Across Our Markets Source: Janus Management Note: Revenue breakdown as of FY2021 New Construction 38% Restore, Rebuild, Replace (“R3”) 30% Commercial 32% 10 Commercial New Construction 38% Commercial 32%
Why We Win
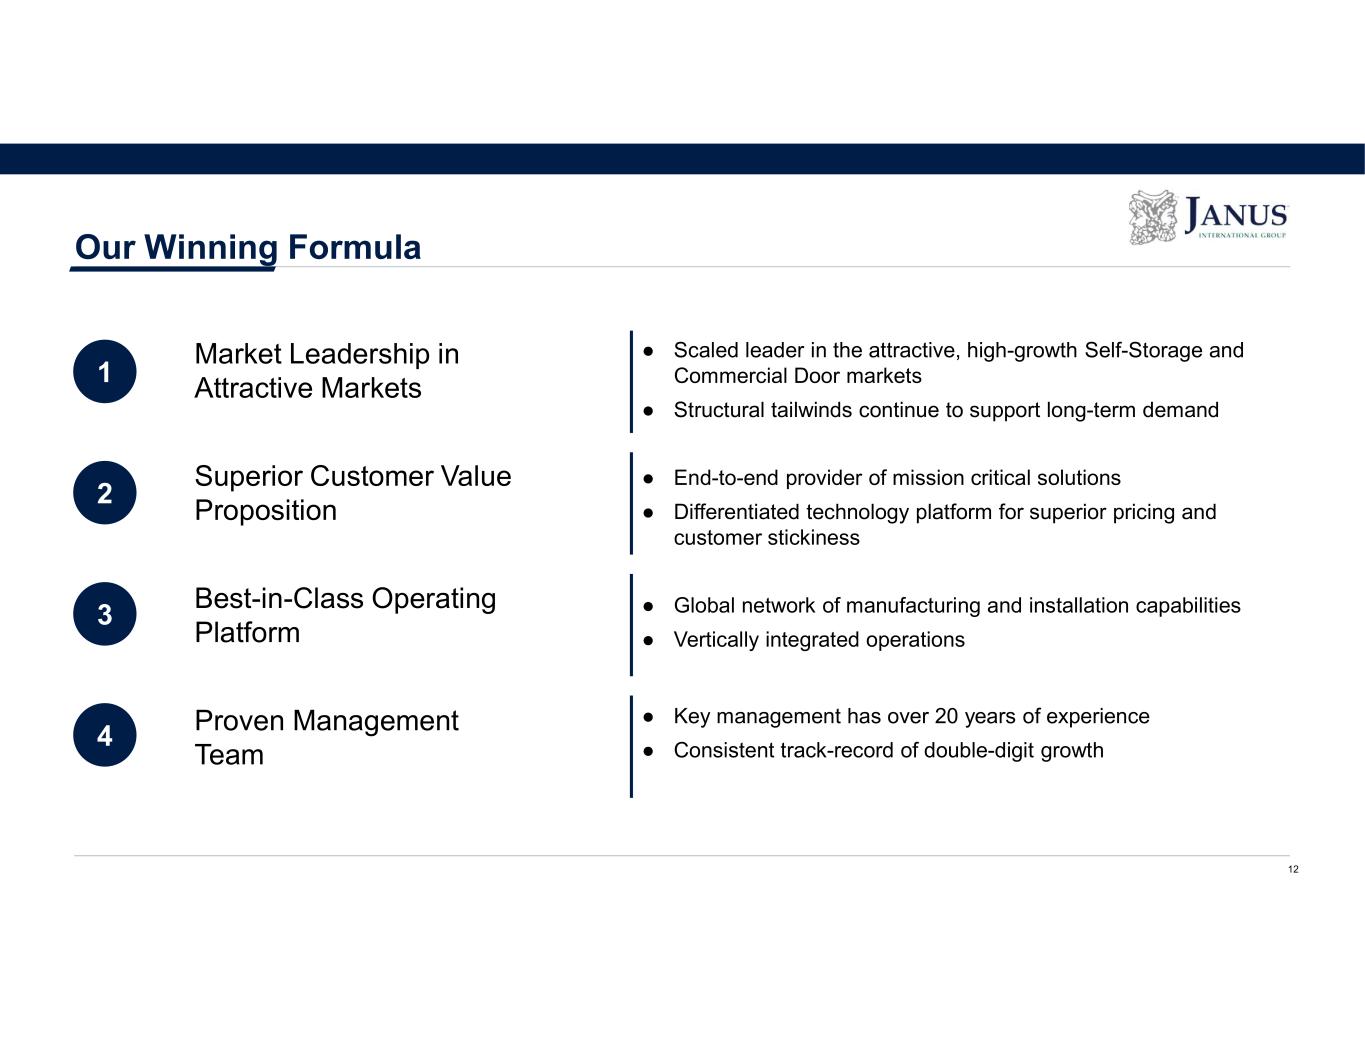
Our Winning Formula • Market Leadership in Attractive Markets • Superior Customer Value Proposition • Best-in-Class Operating Platform • Proven Management Team 1 2 4 3 ● Scaled leader in the attractive, high-growth Self-Storage and Commercial Door markets ● Structural tailwinds continue to support long-term demand ● End-to-end provider of mission critical solutions ● Differentiated technology platform for superior pricing and customer stickiness ● Global network of manufacturing and installation capabilities ● Vertically integrated operations ● Key management has over 20 years of experience ● Consistent track-record of double-digit growth 12
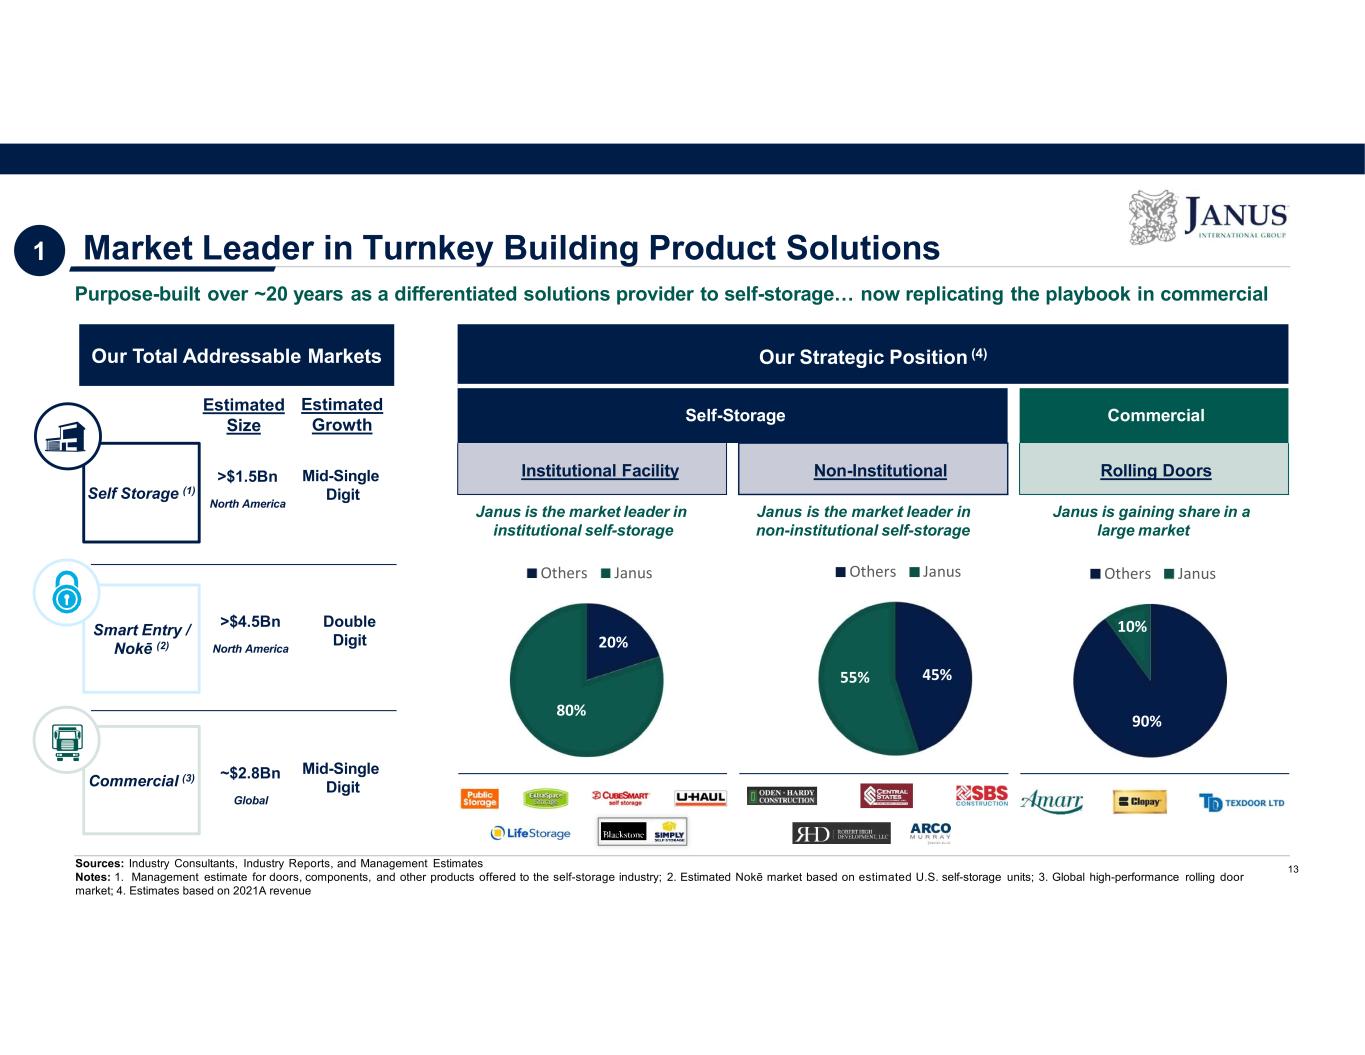
Self Storage (1) Market Leader in Turnkey Building Product Solutions Purpose-built over ~20 years as a differentiated solutions provider to self-storage… now replicating the playbook in commercial Sources: Industry Consultants, Industry Reports, and Management Estimates Notes: 1. Management estimate for doors, components, and other products offered to the self-storage industry; 2. Estimated Nokē market based on estimated U.S. self-storage units; 3. Global high-performance rolling door market; 4. Estimates based on 2021A revenue Mid-Single Digit Double Digit >$1.5Bn North America >$4.5Bn North America ~$2.8Bn Global Our Strategic Position (4) Self-Storage Commercial Institutional Facility Non-Institutional Rolling Doors Janus is the market leader in institutional self-storage Janus is the market leader in non-institutional self-storage Janus is gaining share in a large market Smart Entry / Nokē (2) Our Total Addressable Markets Commercial (3) Mid-Single Digit Estimated Size Estimated Growth 13 1 20% 80% Others Janus 45%55% Others Janus 90% 10% Others Janus
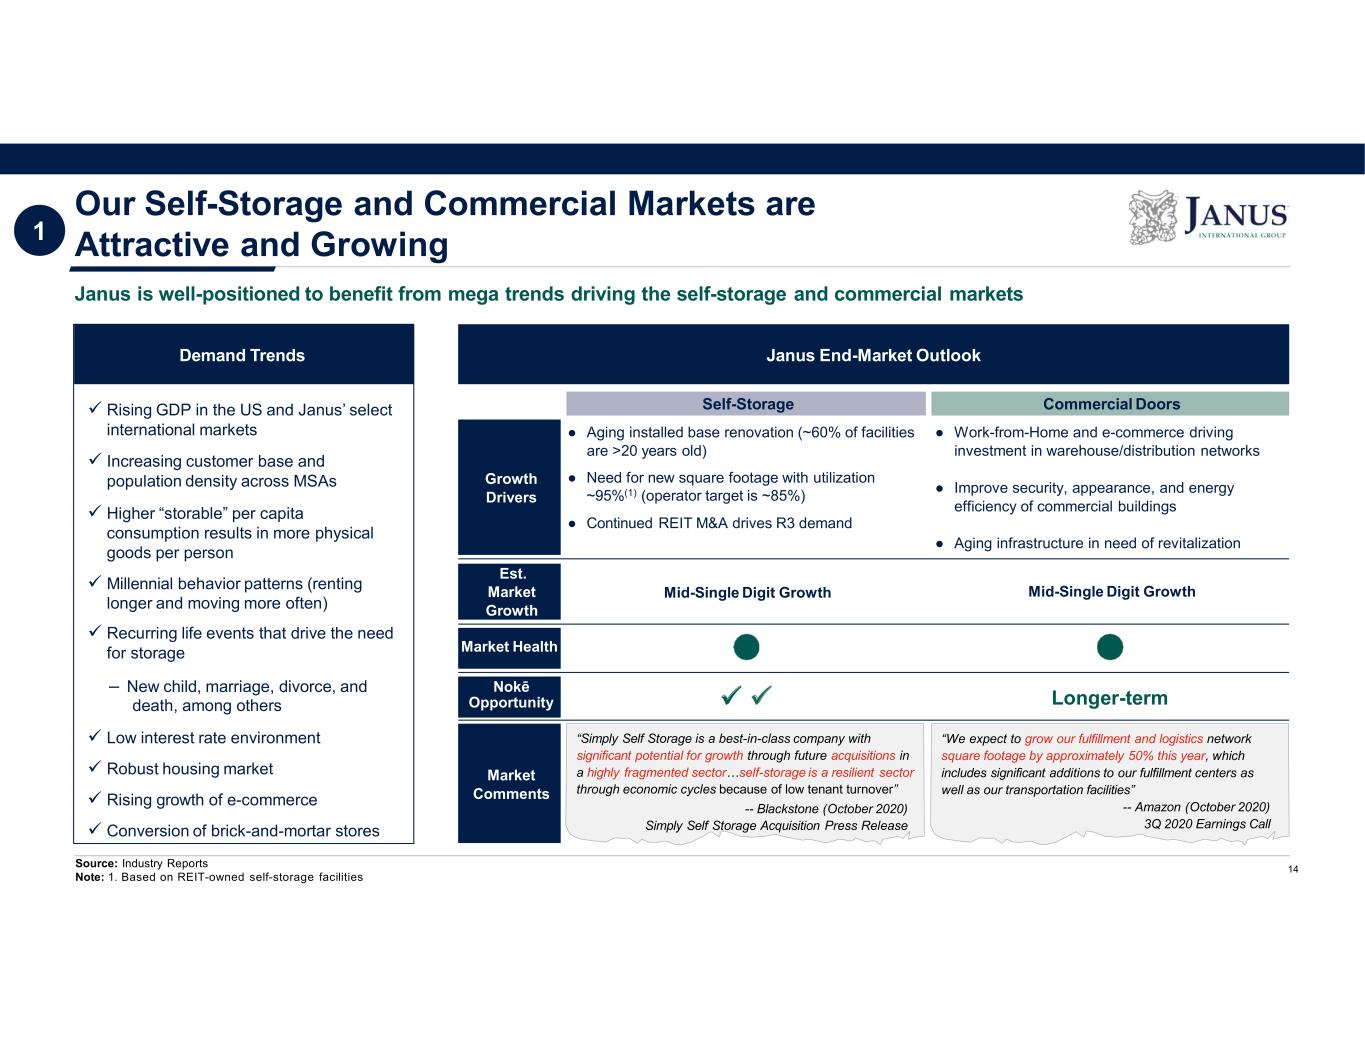
Our Self-Storage and Commercial Markets are Attractive and Growing Demand Trends Rising GDP in the US and Janus’ select international markets Increasing customer base and population density across MSAs Higher “storable” per capita consumption results in more physical goods per person Millennial behavior patterns (renting longer and moving more often) Recurring life events that drive the need for storage – New child, marriage, divorce, and death, among others Low interest rate environment Robust housing market Rising growth of e-commerce Conversion of brick-and-mortar stores Janus End-Market Outlook Self-Storage Commercial Doors Market Health Nokē Opportunity “Simply Self Storage is a best-in-class company with significant potential for growth through future acquisitions in a highly fragmented sector…self-storage is a resilient sector through economic cycles because of low tenant turnover” -- Blackstone (October 2020) Simply Self Storage Acquisition Press Release “We expect to grow our fulfillment and logistics network square footage by approximately 50% this year, which includes significant additions to our fulfillment centers as well as our transportation facilities” -- Amazon (October 2020) 3Q 2020 Earnings Call Market Comments Growth Drivers ● Aging installed base renovation (~60% of facilities are >20 years old) ● Need for new square footage with utilization ~95%(1) (operator target is ~85%) ● Continued REIT M&A drives R3 demand ● Work-from-Home and e-commerce driving investment in warehouse/distribution networks ● Improve security, appearance, and energy efficiency of commercial buildings ● Aging infrastructure in need of revitalization Janus is well-positioned to benefit from mega trends driving the self-storage and commercial markets Est. Market Growth Mid-Single Digit Growth Mid-Single Digit Growth Source: Industry Reports Note: 1. Based on REIT-owned self-storage facilities 1 14 Longer-term 1
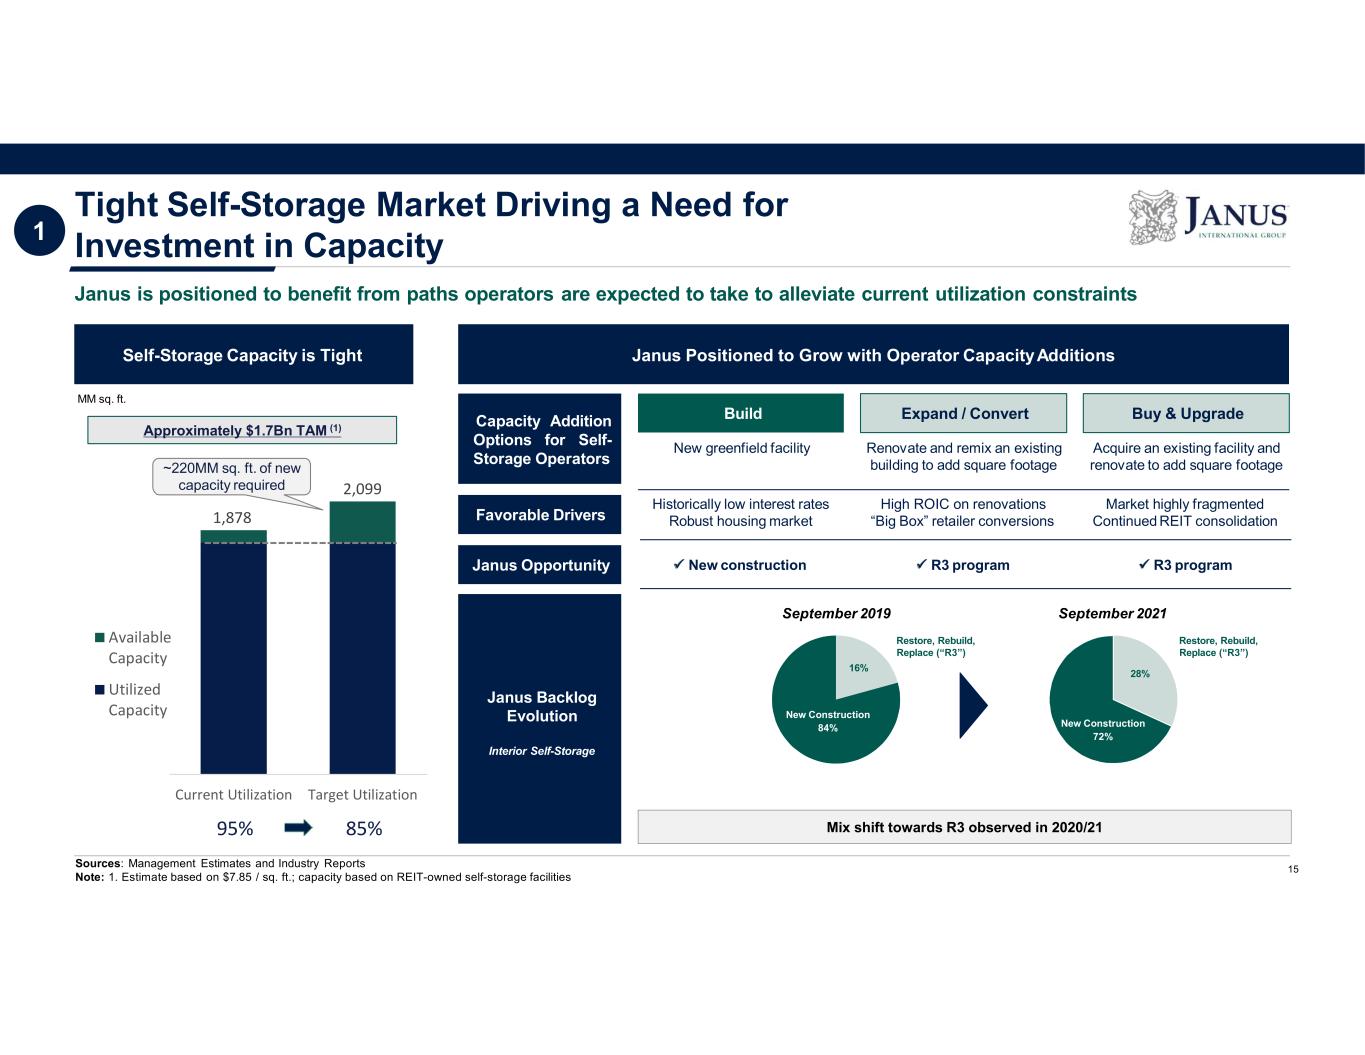
Tight Self-Storage Market Driving a Need for Investment in Capacity Janus is positioned to benefit from paths operators are expected to take to alleviate current utilization constraints Self-Storage Capacity is Tight Janus Positioned to Grow with Operator CapacityAdditions BuildCapacity Addition Options for Self- Storage Operators Expand / Convert Buy & Upgrade New greenfield facility Renovate and remix an existing building to add square footage Acquire an existing facility and renovate to add square footage Janus Opportunity New construction R3 program R3 program Favorable Drivers Historically low interest rates Robust housing market High ROIC on renovations “Big Box” retailer conversions Market highly fragmented Continued REIT consolidation Janus Backlog Evolution Interior Self-Storage September 2019 September 2021 New Construction 84% Restore, Rebuild, Replace (“R3”) Restore, Rebuild, Replace (“R3”) Sources: Management Estimates and Industry Reports Note: 1. Estimate based on $7.85 / sq. ft.; capacity based on REIT-owned self-storage facilities 1 15 16% 28% Mix shift towards R3 observed in 2020/21 New Construction 72% 1 95% 85% 1,878 2,099 Current Utilization Target Utilization Available Capacity Utilized Capacity ~220MM sq. ft. of new capacity required Approximately $1.7Bn TAM (1) MM sq. ft.
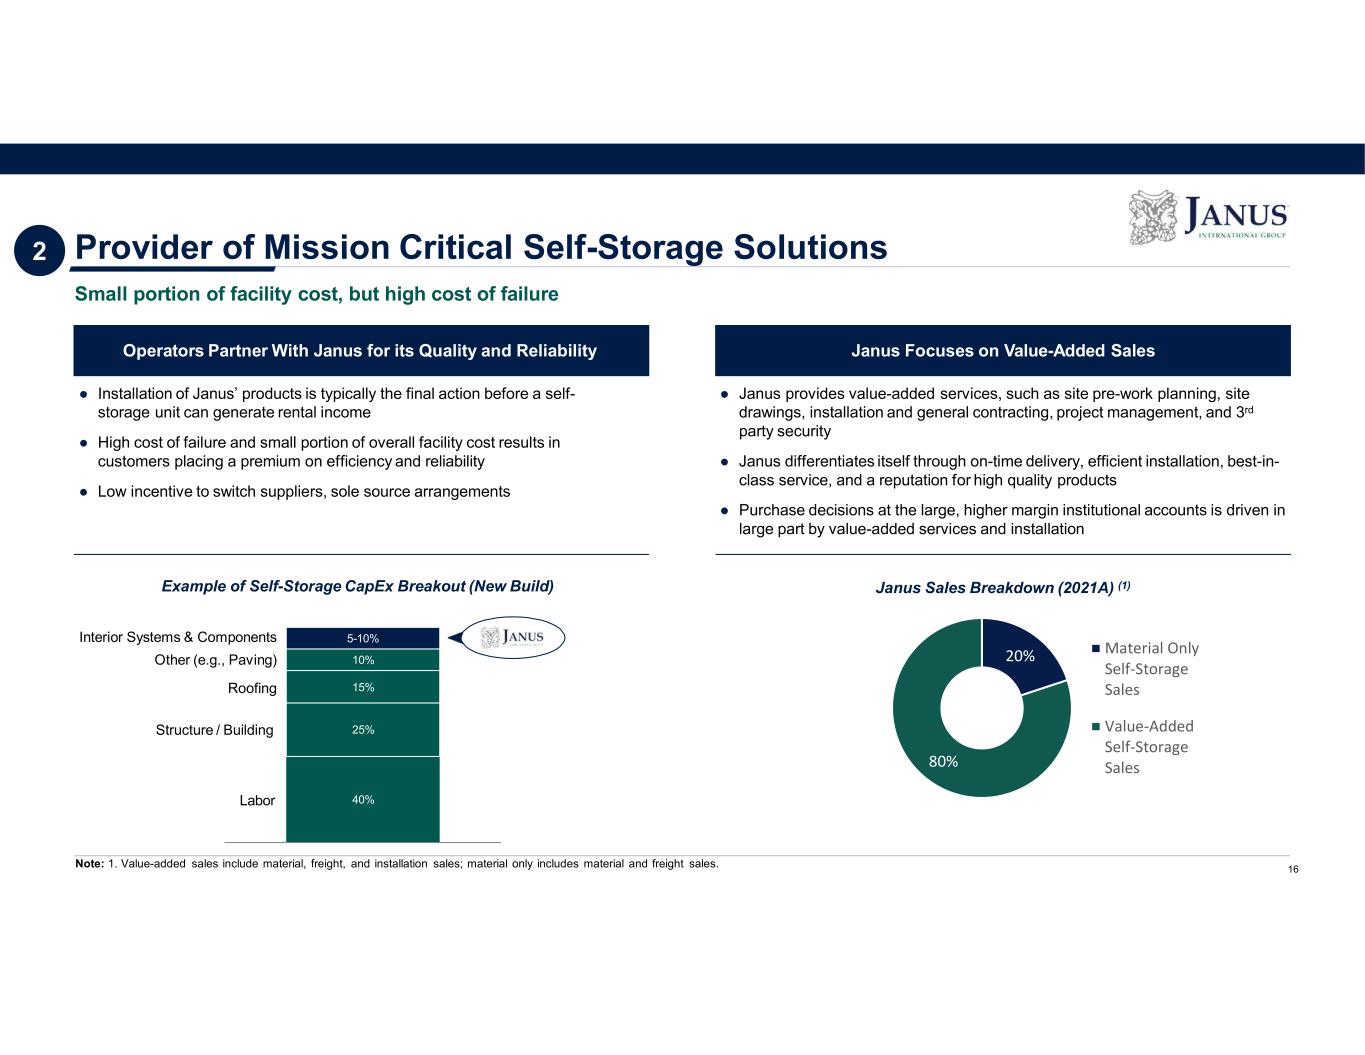
Provider of Mission Critical Self-Storage Solutions Note: 1. Value-added sales include material, freight, and installation sales; material only includes material and freight sales. 40% 25% 10% 15% 5-10% Structure / Building Labor Interior Systems & Components Other (e.g., Paving) Roofing Operators Partner With Janus for its Quality and Reliability Janus Focuses on Value-Added Sales ● Installation of Janus’ products is typically the final action before a self- storage unit can generate rental income ● High cost of failure and small portion of overall facility cost results in customers placing a premium on efficiency and reliability ● Low incentive to switch suppliers, sole source arrangements Example of Self-Storage CapEx Breakout (New Build) ● Janus provides value-added services, such as site pre-work planning, site drawings, installation and general contracting, project management, and 3rd party security ● Janus differentiates itself through on-time delivery, efficient installation, best-in- class service, and a reputation for high quality products ● Purchase decisions at the large, higher margin institutional accounts is driven in large part by value-added services and installation Janus Sales Breakdown (2021A) (1) Small portion of facility cost, but high cost of failure 16 2 20% 80% Material Only Self-Storage Sales Value-Added Self-Storage Sales
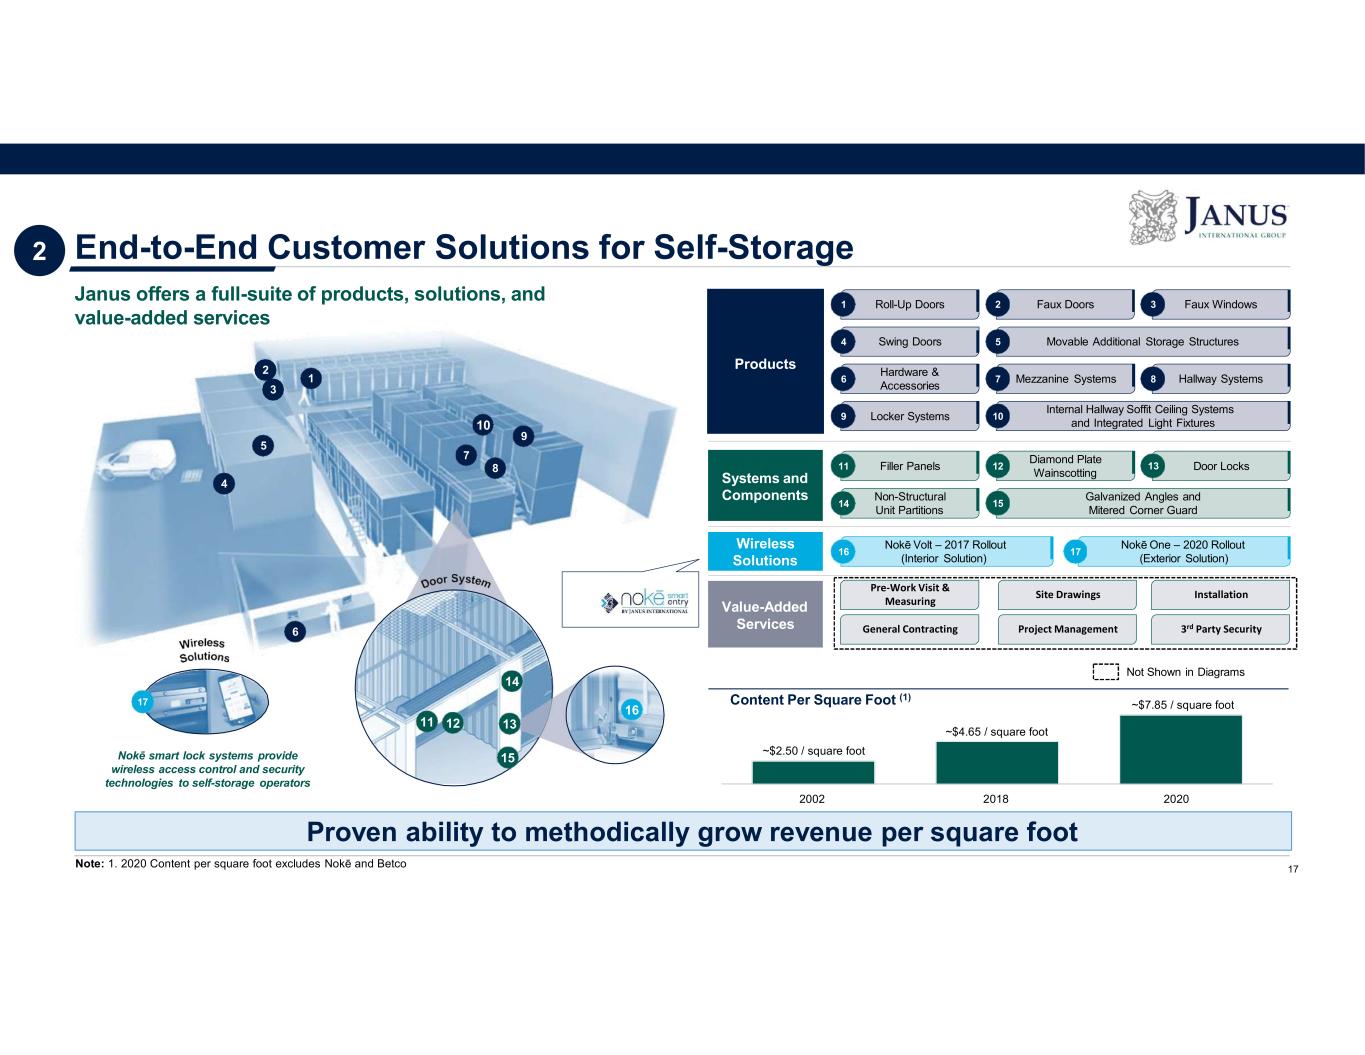
End-to-End Customer Solutions for Self-Storage 1 2 3 4 5 6 7 8 9 10 11 12 13 14 15 16 17 Nokē One – 2020 Rollout (Exterior Solution) Nokē Volt – 2017 Rollout (Interior Solution) 16 17 Mezzanine Systems Hallway Systems Hardware & Accessories 6 87 Swing Doors4 Movable Additional Storage Structures5 Internal Hallway Soffit Ceiling Systems and Integrated Light Fixtures Locker Systems9 10 Diamond Plate Wainscotting 13 Door LocksFiller Panels11 12 Galvanized Angles and Mitered Corner Guard Non-Structural Unit Partitions 14 15 Roll-Up Doors1 Faux Doors2 Faux Windows3 Not Shown in Diagrams Products Systems and Components Wireless Solutions Value-Added Services Janus offers a full-suite of products, solutions, and value-added services Nokē smart lock systems provide wireless access control and security technologies to self-storage operators 2002 2018 2020 ~$2.50 / square foot ~$4.65 / square foot ~$7.85 / square footContent Per Square Foot (1) Pre-Work Visit & Measuring General Contracting Site Drawings Project Management Installation 3rd Party Security Proven ability to methodically grow revenue per square foot 17Note: 1. 2020 Content per square foot excludes Nokē and Betco 2
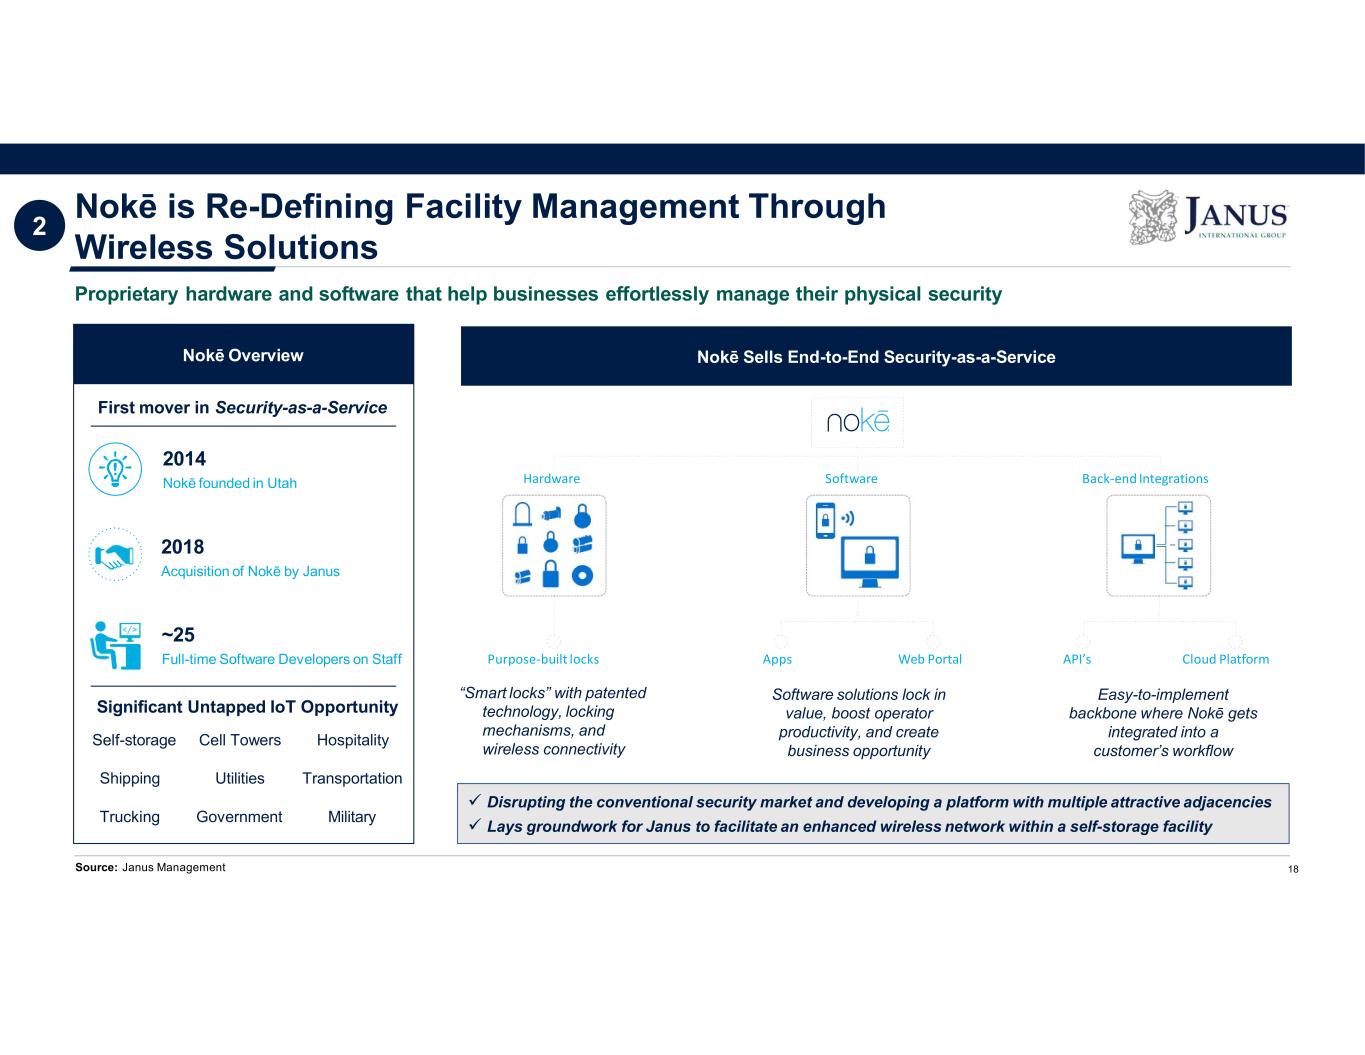
Nokē is Re-Defining Facility Management Through Wireless Solutions Nokē Overview 2018 Acquisition of Nokē by Janus First mover in Security-as-a-Service 2014 Nokē founded in Utah ~25 Full-time Software Developers on Staff Significant Untapped IoT Opportunity Self-storage Cell Towers Hospitality Shipping Utilities Transportation Trucking Government Military Nokē Sells End-to-End Security-as-a-Service “Smart locks” with patented technology, locking mechanisms, and wireless connectivity Proprietary hardware and software that help businesses effortlessly manage their physical security Hardware Purpose-built locks Apps Web Portal Software solutions lock in value, boost operator productivity, and create business opportunity API’s Cloud Platform Easy-to-implement backbone where Nokē gets integrated into a customer’s workflow Software Back-end Integrations 18 Disrupting the conventional security market and developing a platform with multiple attractive adjacencies Lays groundwork for Janus to facilitate an enhanced wireless network within a self-storage facility 2 Source: Janus Management
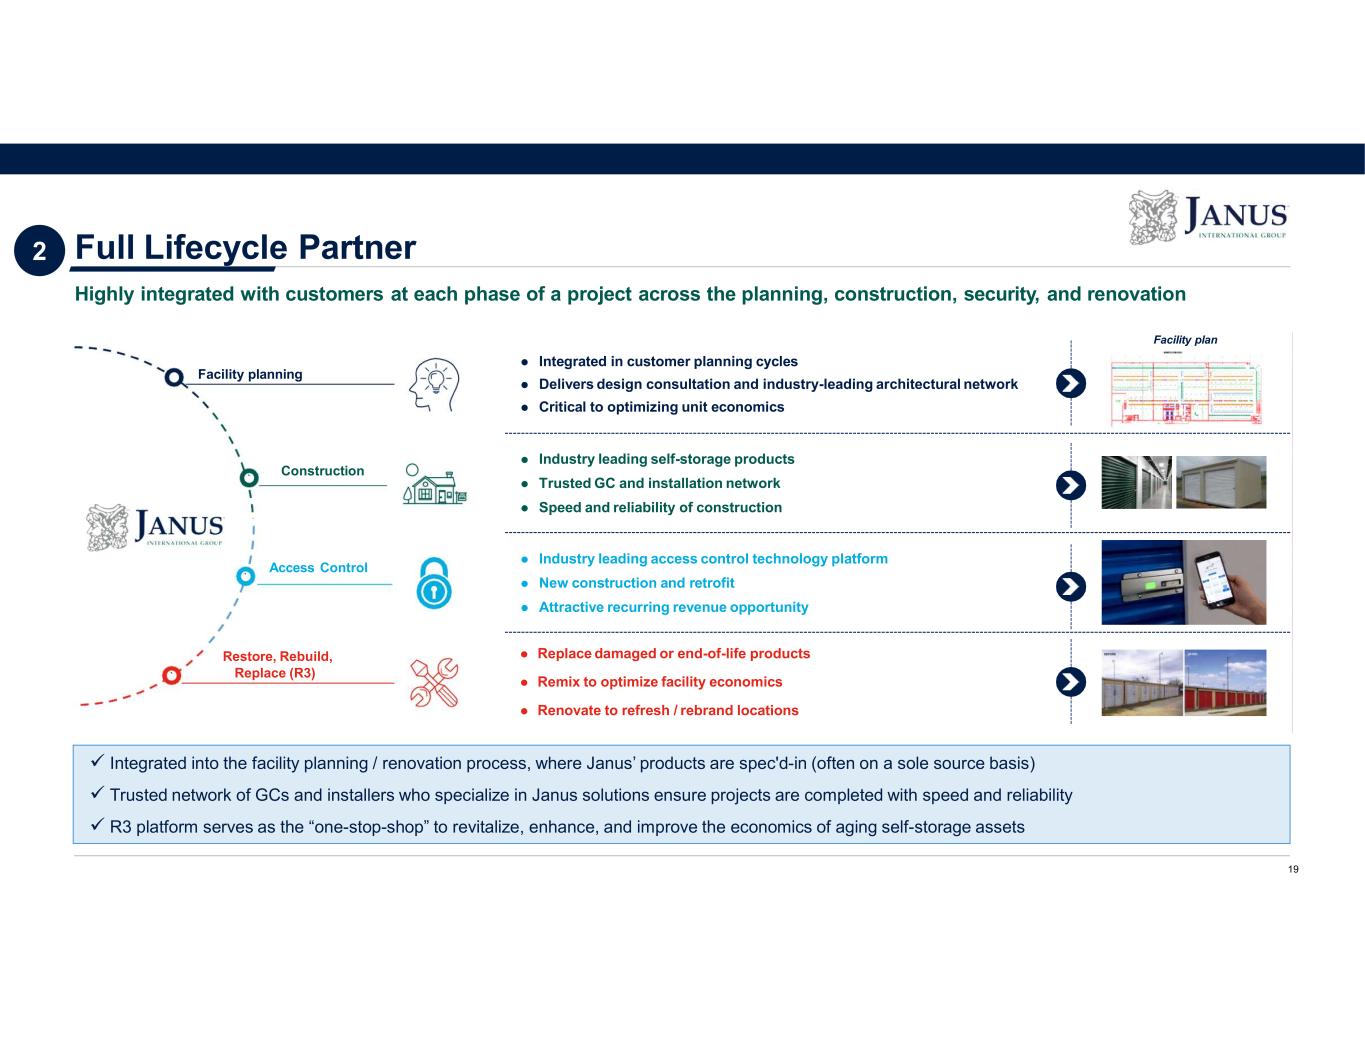
Full Lifecycle Partner ` ` ` Restore, Rebuild, Replace (R3) Construction Facility planning Access Control Integrated in customer planning cycles Delivers design consultation and industry-leading architectural network Critical to optimizing unit economics Industry leading self-storage products Trusted GC and installation network Speed and reliability of construction Replace damaged or end-of-life products Remix to optimize facility economics Renovate to refresh / rebrand locations Industry leading access control technology platform New construction and retrofit Attractive recurring revenue opportunity Facility plan Highly integrated with customers at each phase of a project across the planning, construction, security, and renovation 19 Integrated into the facility planning / renovation process, where Janus’ products are spec'd-in (often on a sole source basis) Trusted network of GCs and installers who specialize in Janus solutions ensure projects are completed with speed and reliability R3 platform serves as the “one-stop-shop” to revitalize, enhance, and improve the economics of aging self-storage assets 2
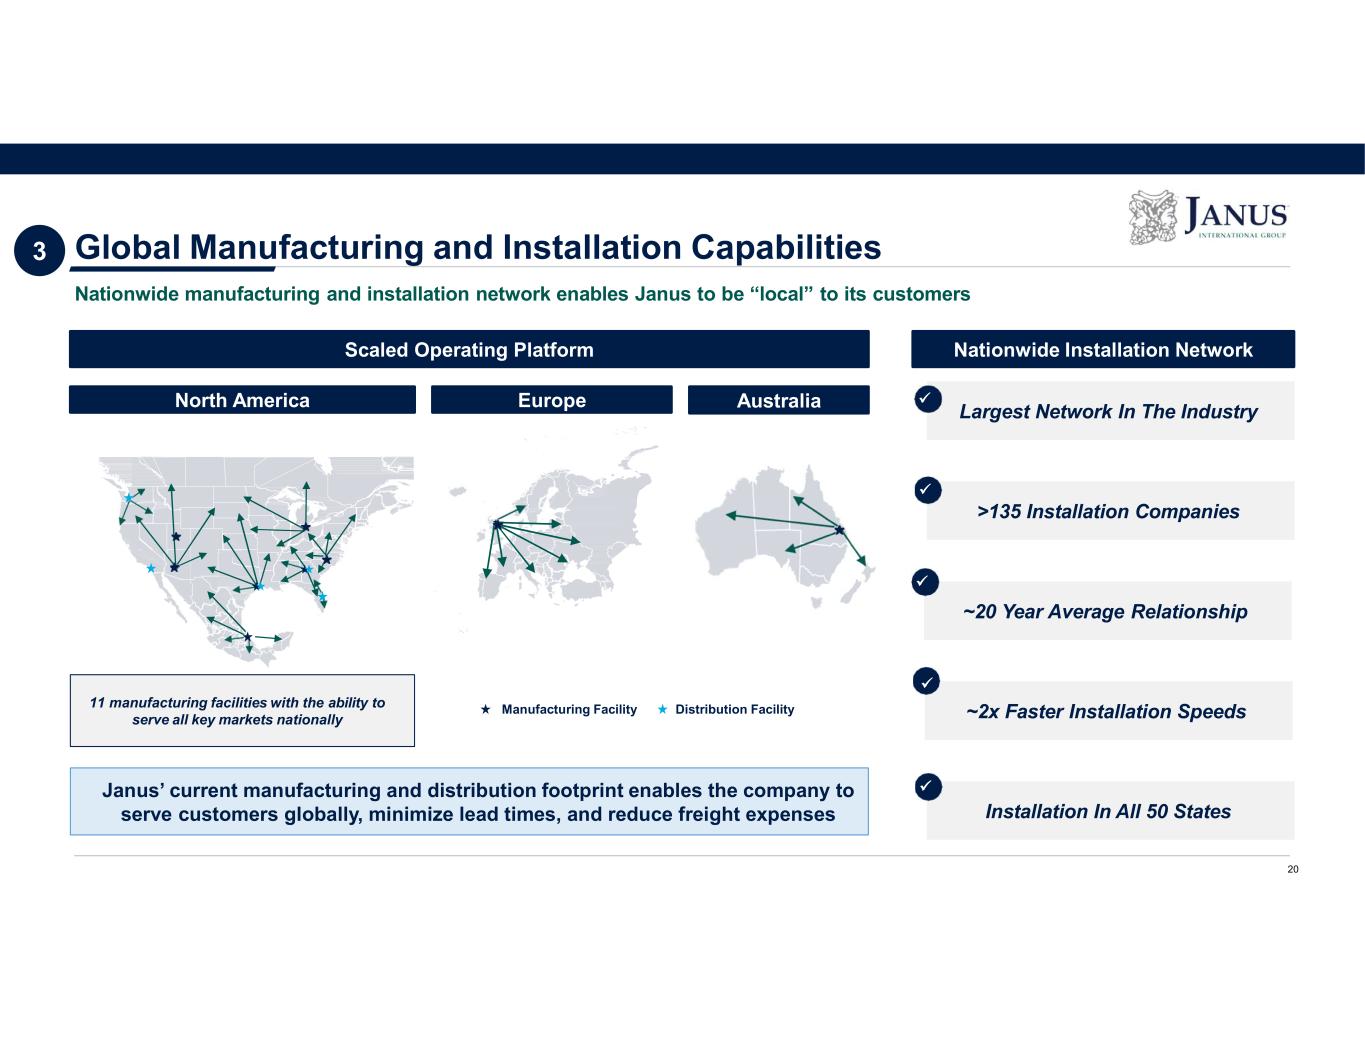
Global Manufacturing and Installation Capabilities Nationwide manufacturing and installation network enables Janus to be “local” to its customers Scaled Operating Platform North America Europe Australia Janus’ current manufacturing and distribution footprint enables the company to serve customers globally, minimize lead times, and reduce freight expenses Nationwide Installation Network Largest Network In The Industry >135 Installation Companies ~20 Year Average Relationship ~2x Faster Installation Speeds Installation In All 50 States 20 11 manufacturing facilities with the ability to serve all key markets nationally 3 Manufacturing Facility Distribution Facility

Our Growth Strategy
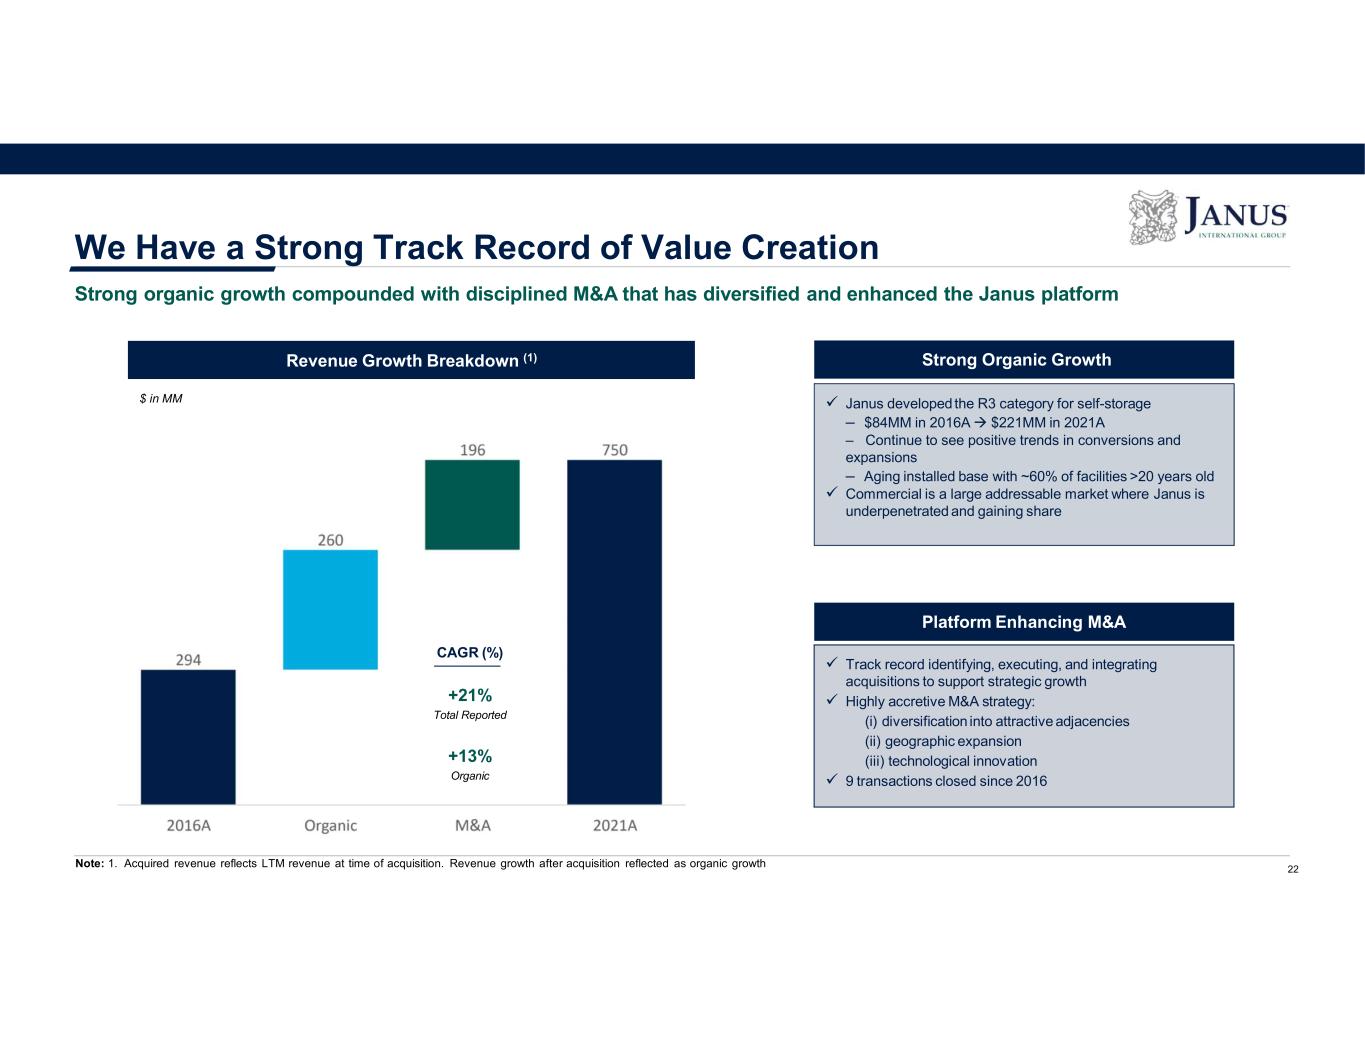
We Have a Strong Track Record of Value Creation Note: 1. Acquired revenue reflects LTM revenue at time of acquisition. Revenue growth after acquisition reflected as organic growth Strong organic growth compounded with disciplined M&A that has diversified and enhanced the Janus platform Platform Enhancing M&A Janus developed the R3 category for self-storage – $84MM in 2016A $221MM in 2021A – Continue to see positive trends in conversions and expansions – Aging installed base with ~60% of facilities >20 years old Commercial is a large addressable market where Janus is underpenetrated and gaining share $ in MM Track record identifying, executing, and integrating acquisitions to support strategic growth Highly accretive M&A strategy: (i) diversification into attractive adjacencies (ii) geographic expansion (iii) technological innovation 9 transactions closed since 2016 22 CAGR (%) +21% Total Reported +13% Organic Strong Organic GrowthRevenue Growth Breakdown (1)
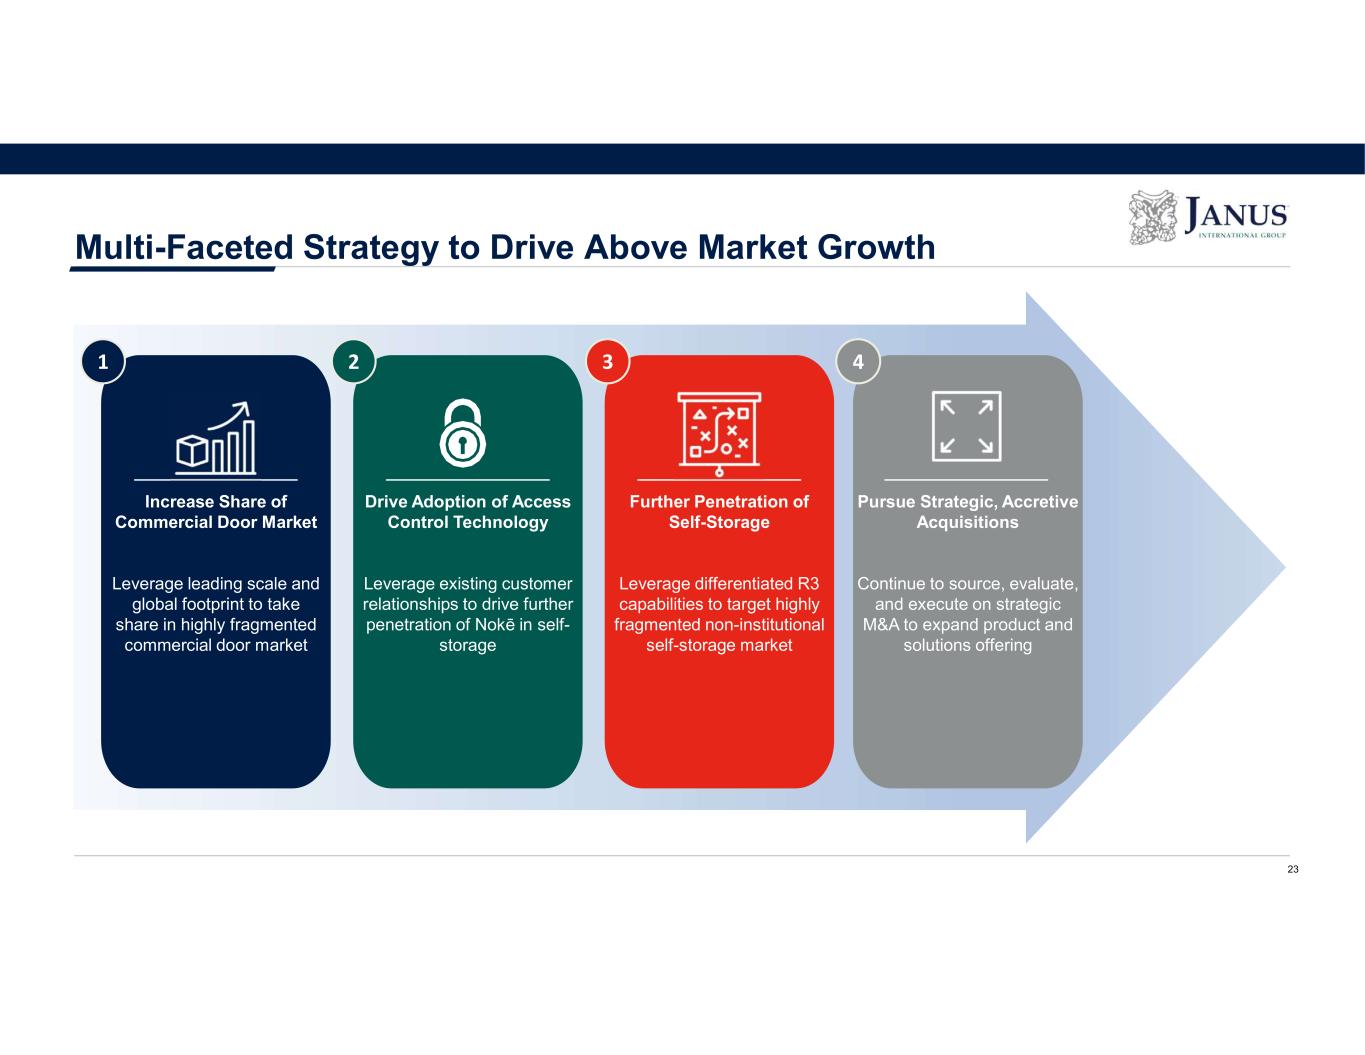
Multi-Faceted Strategy to Drive Above Market Growth2 Drive Adoption of Access Control Technology Leverage existing customer relationships to drive further penetration of Nokē in self- storage 2 Increase Share of Commercial Door Market Leverage leading scale and global footprint to take share in highly fragmented commercial door market 1 Pursue Strategic, Accretive Acquisitions Continue to source, evaluate, and execute on strategic M&A to expand product and solutions offering 4 Further Penetration of Self-Storage Leverage differentiated R3 capabilities to target highly fragmented non-institutional self-storage market 3 23
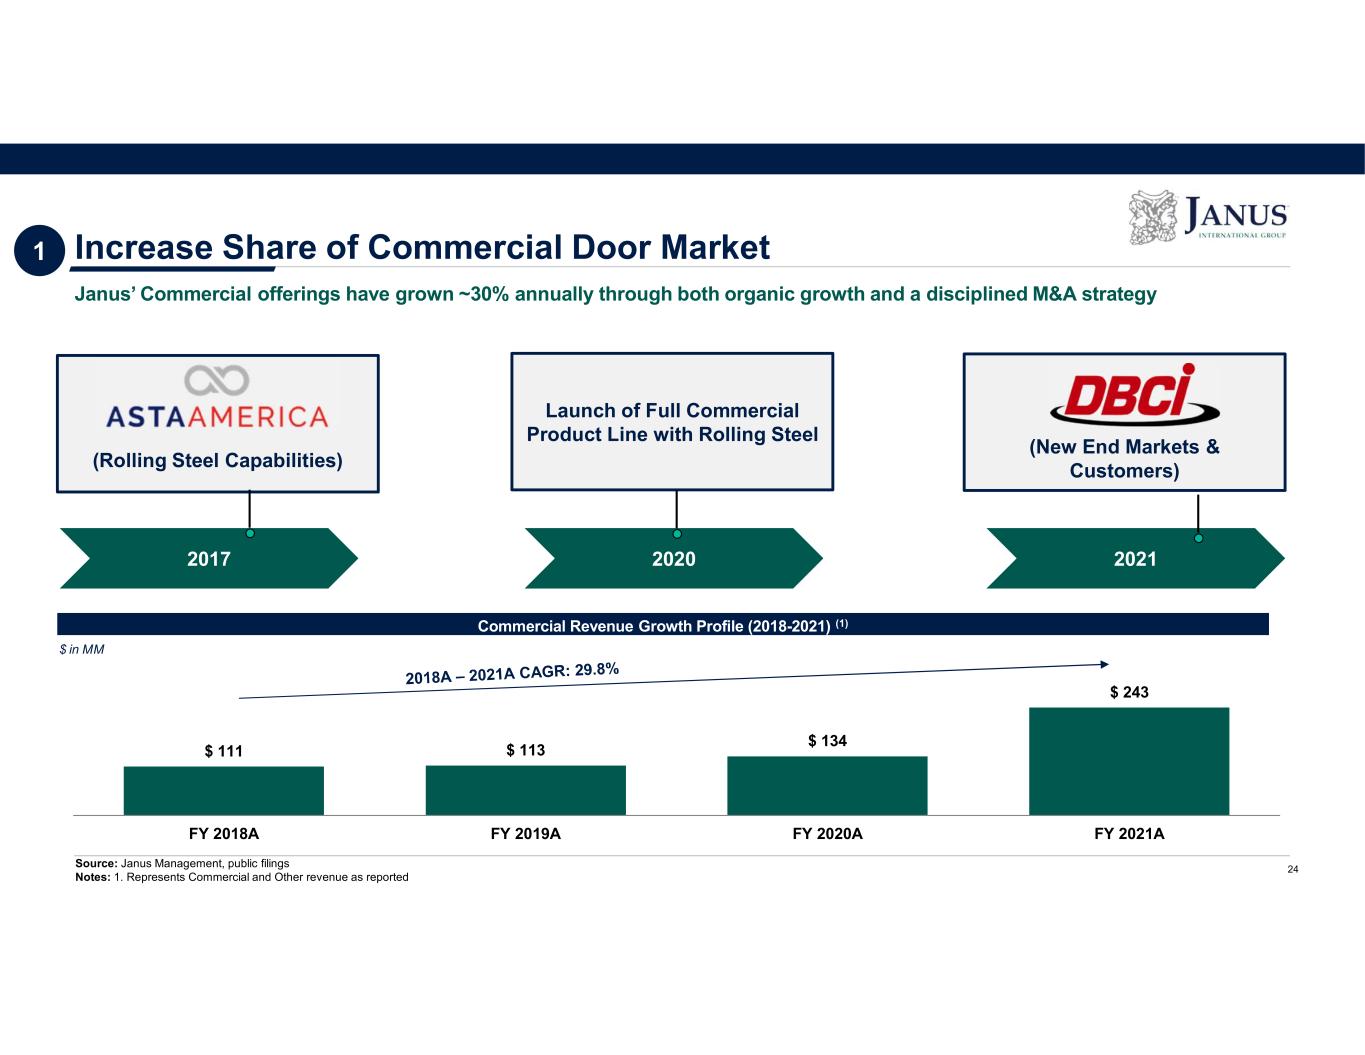
Increase Share of Commercial Door Market 24 Janus’ Commercial offerings have grown ~30% annually through both organic growth and a disciplined M&A strategy (Rolling Steel Capabilities) 2017 2020 2021 Launch of Full Commercial Product Line with Rolling Steel (New End Markets & Customers) $ 111 $ 113 $ 134 $ 243 FY 2018A FY 2019A FY 2020A FY 2021A Commercial Revenue Growth Profile (2018-2021) (1) $ in MM Source: Janus Management, public filings Notes: 1. Represents Commercial and Other revenue as reported 1
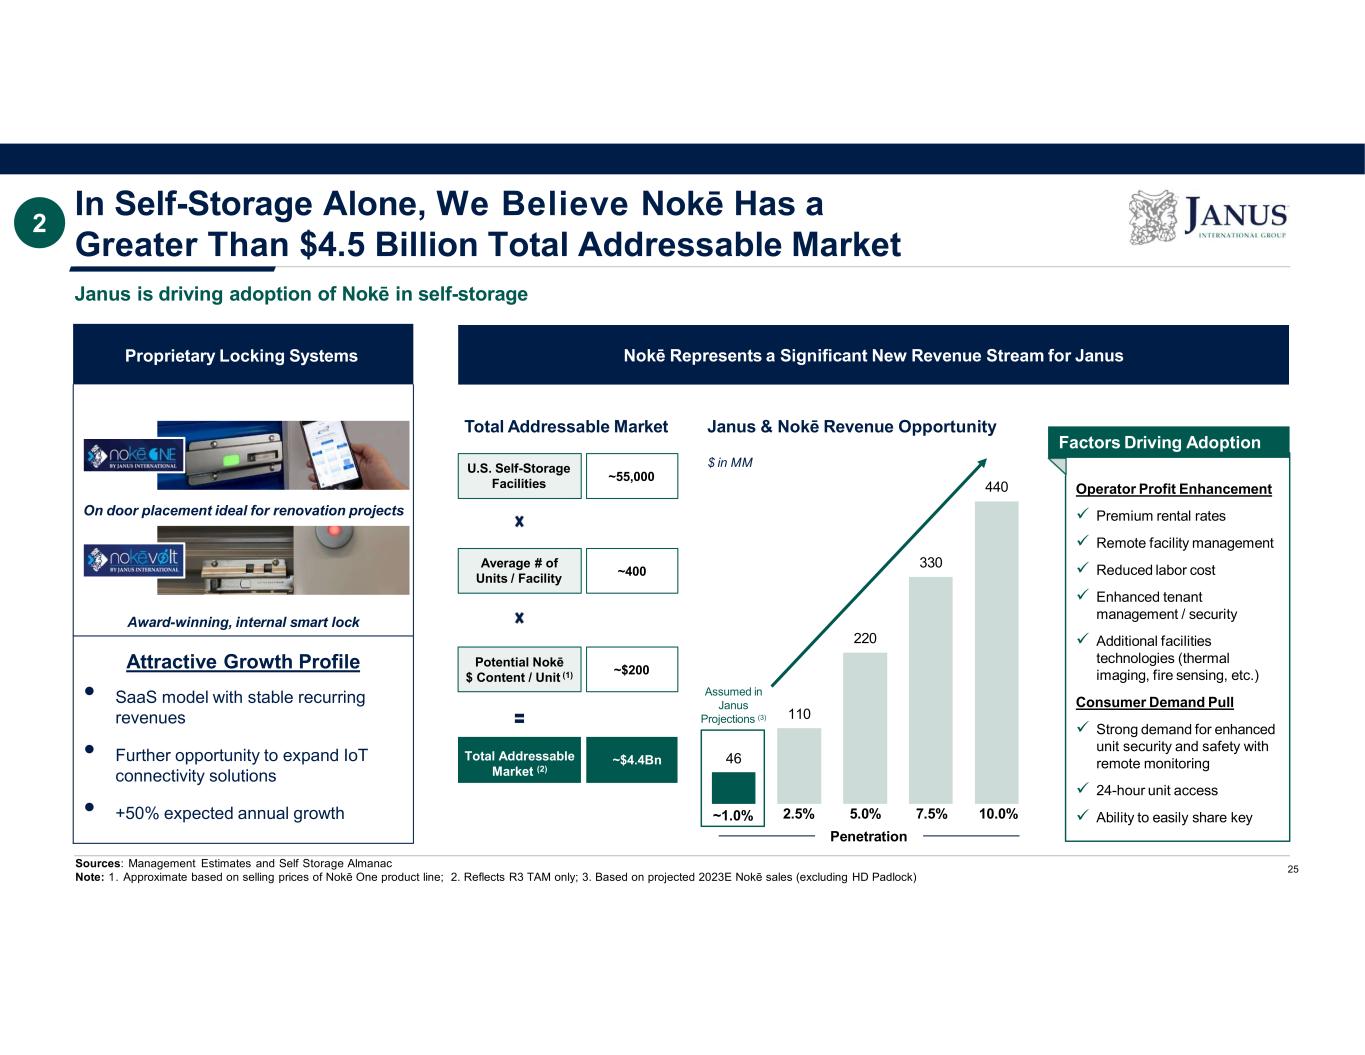
Operator Profit Enhancement Premium rental rates Remote facility management Reduced labor cost Enhanced tenant management / security Additional facilities technologies (thermal imaging, fire sensing, etc.) Consumer Demand Pull Strong demand for enhanced unit security and safety with remote monitoring 24-hour unit access Ability to easily share key Proprietary Locking Systems On door placement ideal for renovation projects Award-winning, internal smart lock In Self-Storage Alone, We Believe Nokē Has a Greater Than $4.5 Billion Total Addressable Market Nokē Represents a Significant New Revenue Stream for Janus Sources: Management Estimates and Self Storage Almanac Note: 1. Approximate based on selling prices of Nokē One product line; 2. Reflects R3 TAM only; 3. Based on projected 2023E Nokē sales (excluding HD Padlock) U.S. Self-Storage Facilities ~55,000 Total Addressable Market (2) ~$4.4Bn ~$200 Average # of Units / Facility ~400 46 ~1.0% 110 220 330 440 2.5% 5.0% 7.5% 10.0% Total Addressable Market Janus & Nokē Revenue Opportunity $ in MM Penetration Factor Driving AdoptionFactors Driving Adoption Janus is driving adoption of Nokē in self-storage Assumed in Janus Projections (3) 25 Attractive Growth Profile • SaaS model with stable recurring revenues • Further opportunity to expand IoT connectivity solutions • +50% expected annual growth 2 Potential Nokē $ Content / Unit (1)
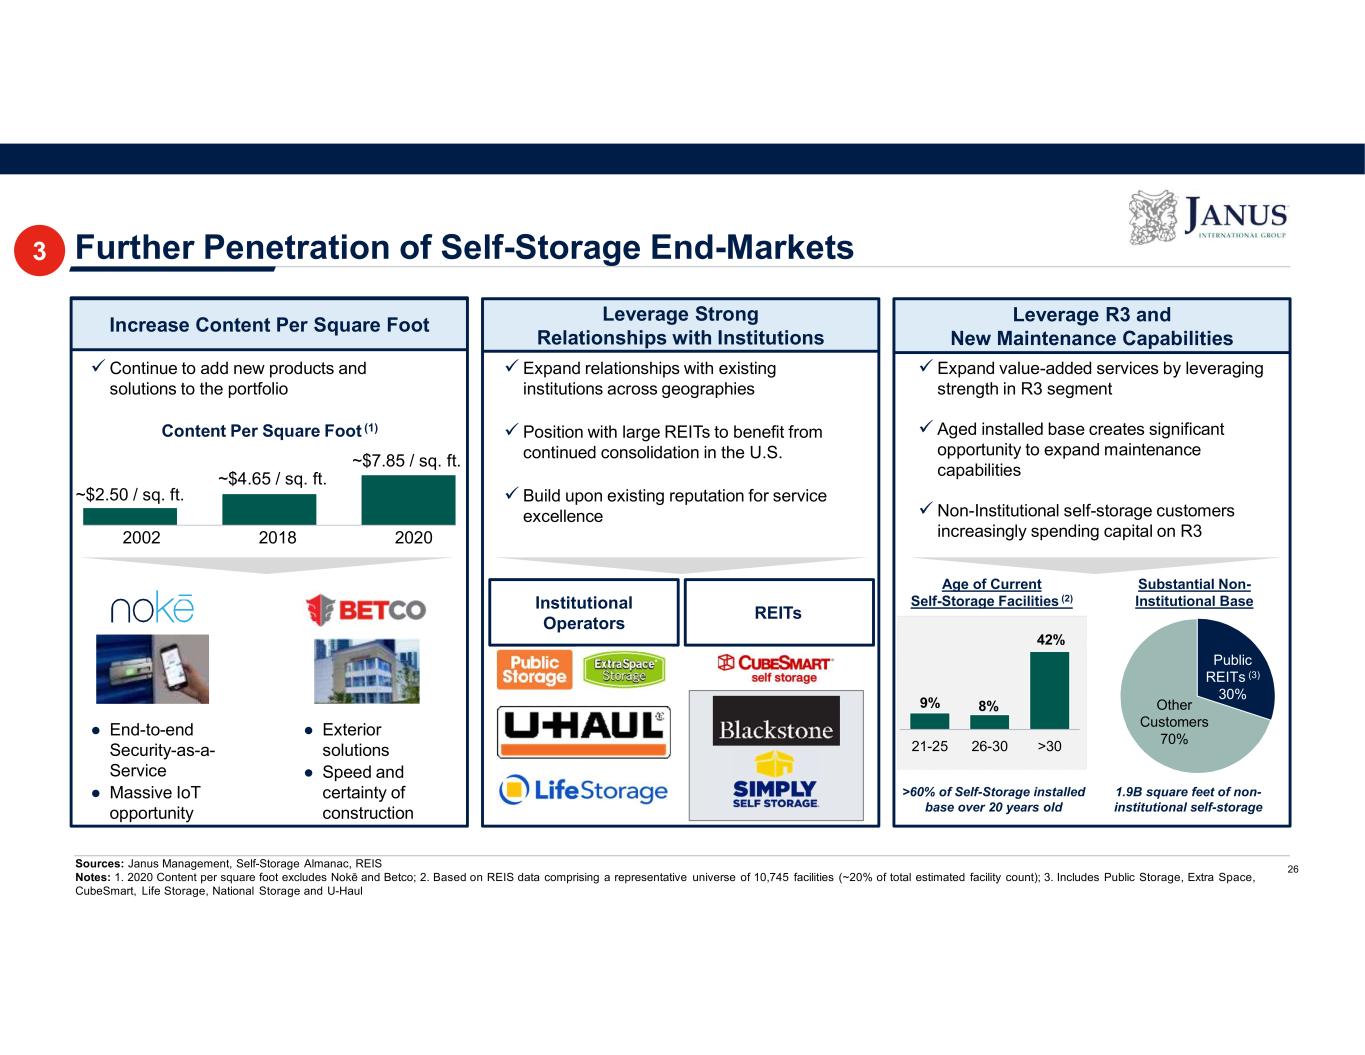
9% 8% 21-25 26-30 >30 42% Further Penetration of Self-Storage End-Markets 26 Increase Content Per Square Foot Leverage Strong Relationships with Institutions Leverage R3 and New Maintenance Capabilities 2002 2018 2020 ~$2.50 / sq. ft. ~$4.65 / sq. ft. ~$7.85 / sq. ft. Content Per Square Foot (1) Continue to add new products and solutions to the portfolio ● End-to-end Security-as-a- Service ● Massive IoT opportunity ● Exterior solutions ● Speed and certainty of construction Expand relationships with existing institutions across geographies Position with large REITs to benefit from continued consolidation in the U.S. Build upon existing reputation for service excellence Institutional Operators REITs Expand value-added services by leveraging strength in R3 segment Aged installed base creates significant opportunity to expand maintenance capabilities Non-Institutional self-storage customers increasingly spending capital on R3 >60% of Self-Storage installed base over 20 years old 1.9B square feet of non- institutional self-storage Public REITs (3) 30% Other Customers 70% Sources: Janus Management, Self-Storage Almanac, REIS Notes: 1. 2020 Content per square foot excludes Nokē and Betco; 2. Based on REIS data comprising a representative universe of 10,745 facilities (~20% of total estimated facility count); 3. Includes Public Storage, Extra Space, CubeSmart, Life Storage, National Storage and U-Haul Substantial Non- Institutional Base Age of Current Self-Storage Facilities (2) 3
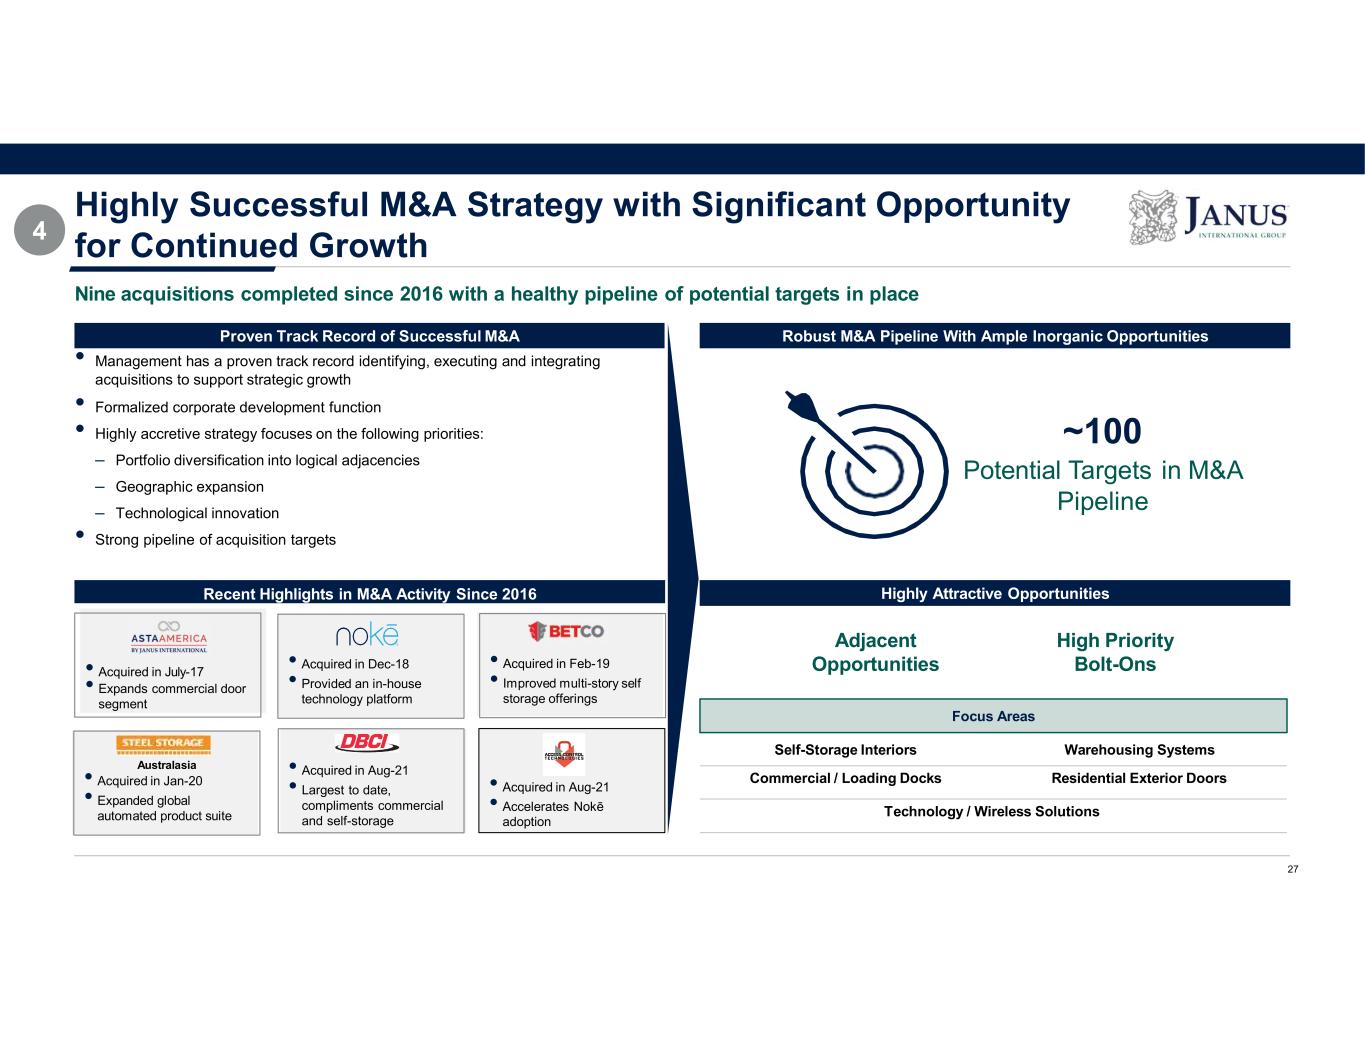
Proven Track Record of Successful M&A Robust M&A Pipeline With Ample Inorganic Opportunities • Management has a proven track record identifying, executing and integrating acquisitions to support strategic growth • Formalized corporate development function • Highly accretive strategy focuses on the following priorities: – Portfolio diversification into logical adjacencies – Geographic expansion – Technological innovation • Strong pipeline of acquisition targets Recent Highlights in M&A Activity Since 2016 Highly Attractive Opportunities • Acquired in Dec-18 • Provided an in-house technology platform • Acquired in Feb-19 • Improved multi-story self storage offerings Australasia • Acquired in Jan-20 • Expanded global automated product suite • Acquired in Aug-21 • Accelerates Nokē adoption • Acquired in July-17 • Expands commercial door segment Focus Areas Self-Storage Interiors Warehousing Systems Commercial / Loading Docks Residential Exterior Doors Technology / Wireless Solutions Highly Successful M&A Strategy with Significant Opportunity for Continued Growth Nine acquisitions completed since 2016 with a healthy pipeline of potential targets in place Adjacent Opportunities High Priority Bolt-Ons 27 ~100 Potential Targets in M&A Pipeline 4 • Acquired in Aug-21 • Largest to date, compliments commercial and self-storage
Financial Performance
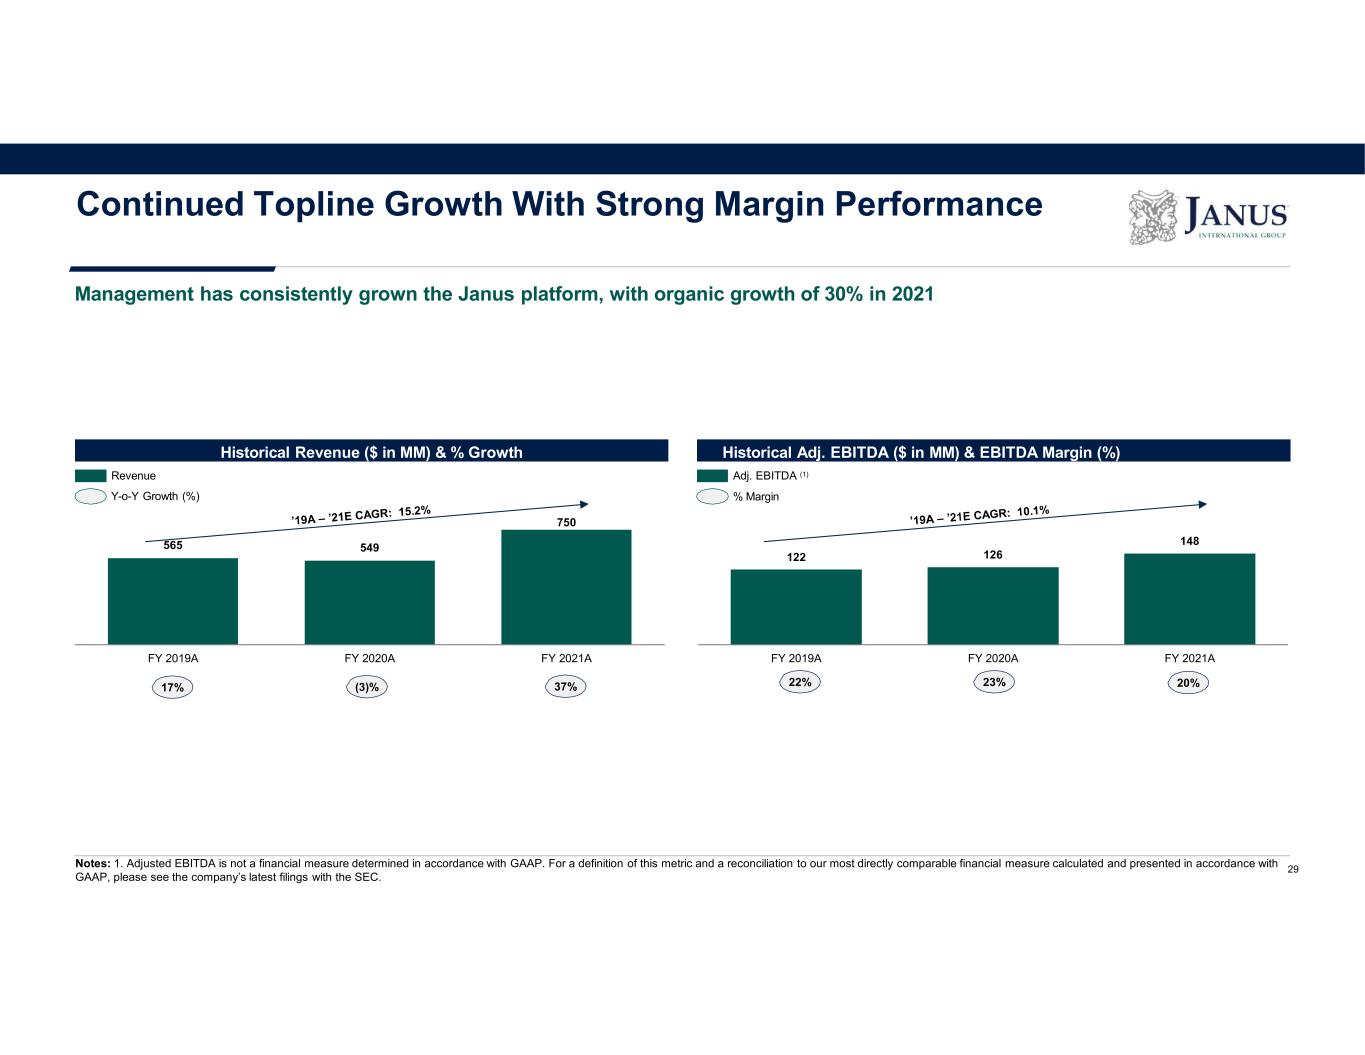
122 126 148 FY 2019A FY 2020A FY 2021A 565 549 750 FY 2019A FY 2020A FY 2021A Continued Topline Growth With Strong Margin Performance Historical Adj. EBITDA ($ in MM) & EBITDA Margin (%)Historical Revenue ($ in MM) & % Growth 17% (3)% 37% Y-o-Y Growth (%) Revenue Adj. EBITDA (1) % Margin Management has consistently grown the Janus platform, with organic growth of 30% in 2021 Notes: 1. Adjusted EBITDA is not a financial measure determined in accordance with GAAP. For a definition of this metric and a reconciliation to our most directly comparable financial measure calculated and presented in accordance with GAAP, please see the company’s latest filings with the SEC. 22% 23% 20% 29
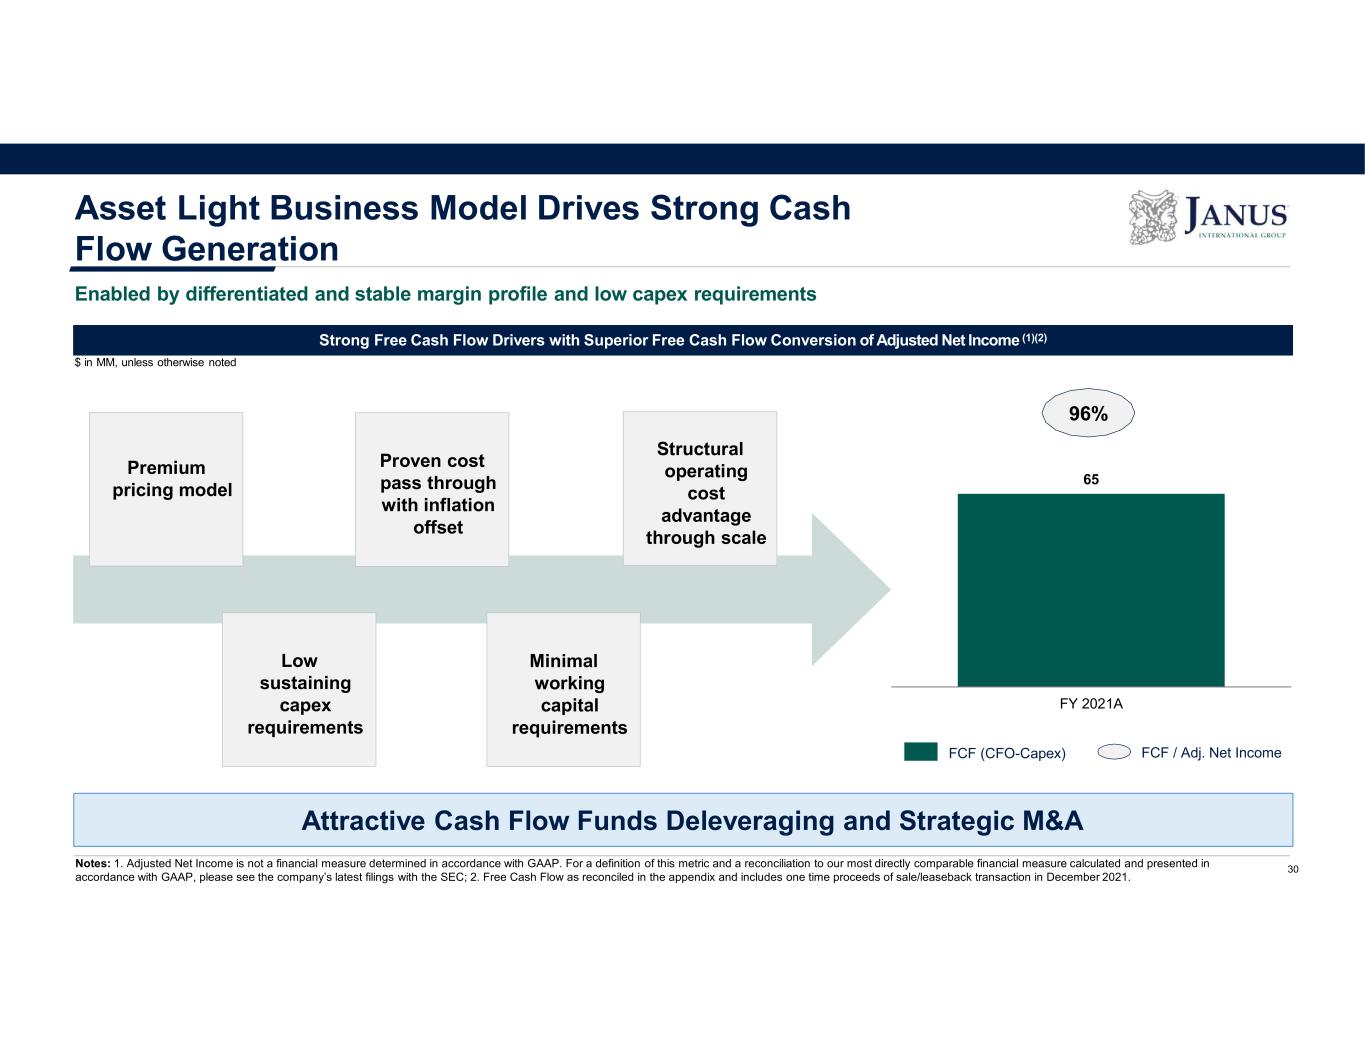
96% Attractive Cash Flow Funds Deleveraging and Strategic M&A Notes: 1. Adjusted Net Income is not a financial measure determined in accordance with GAAP. For a definition of this metric and a reconciliation to our most directly comparable financial measure calculated and presented in accordance with GAAP, please see the company’s latest filings with the SEC; 2. Free Cash Flow as reconciled in the appendix and includes one time proceeds of sale/leaseback transaction in December 2021. Strong Free Cash Flow Drivers with Superior Free Cash Flow Conversion of Adjusted Net Income (1)(2) $ in MM, unless otherwise noted Premium pricing model Asset Light Business Model Drives Strong Cash Flow Generation Enabled by differentiated and stable margin profile and low capex requirements 30 65 FY 2021A Proven cost pass through with inflation offset Structural operating cost advantage through scale Low sustaining capex requirements Minimal working capital requirements FCF (CFO-Capex) FCF / Adj. Net Income
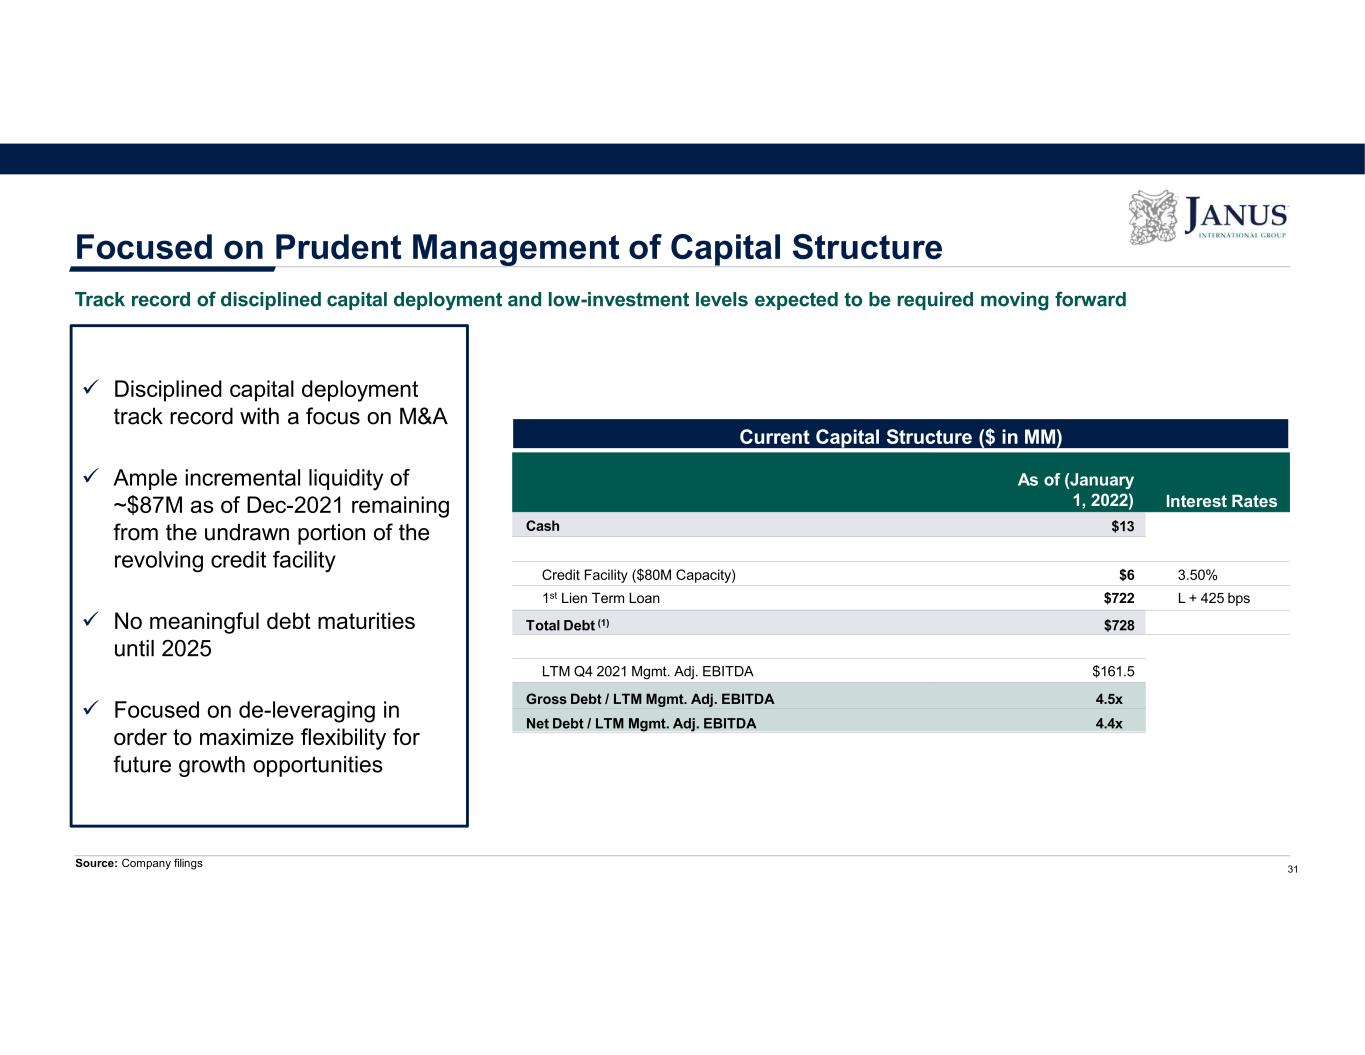
Focused on Prudent Management of Capital Structure Track record of disciplined capital deployment and low-investment levels expected to be required moving forward 31 Disciplined capital deployment track record with a focus on M&A Ample incremental liquidity of ~$87M as of Dec-2021 remaining from the undrawn portion of the revolving credit facility No meaningful debt maturities until 2025 Focused on de-leveraging in order to maximize flexibility for future growth opportunities Source: Company filings Current Capital Structure ($ in MM) As of (January 1, 2022) Interest Rates Cash 1st Lien Term Loan $722 L + 425 bps Total Debt (1) $728 LTM Q4 2021 Mgmt. Adj. EBITDA $161.5 Gross Debt / LTM Mgmt. Adj. EBITDA 4.5x Net Debt / LTM Mgmt. Adj. EBITDA 4.4x $13 Credit Facility ($80M Capacity) $6 3.50%

APPENDIX A Supplemental Materials
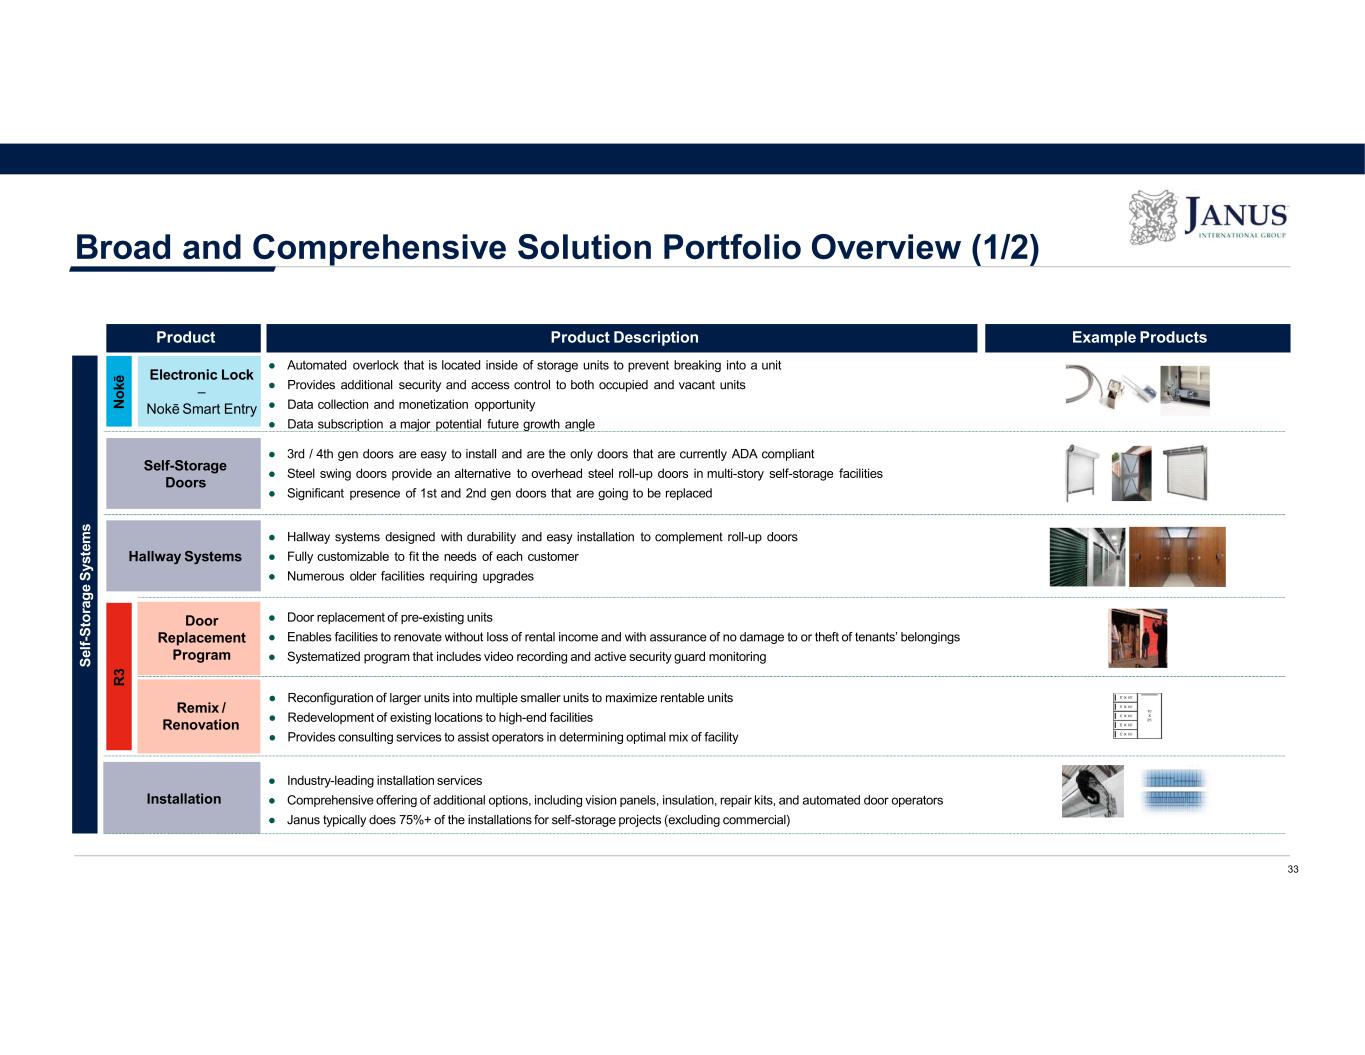
Broad and Comprehensive Solution Portfolio Overview (1/2) Product Product Description Example Products S el f- S to ra g e S ys te m s Self-Storage Doors Hallway Systems Door Replacement Program R 3 Installation Electronic Lock – Nokē Smart EntryN o kē ● Automated overlock that is located inside of storage units to prevent breaking into a unit ● Provides additional security and access control to both occupied and vacant units ● Data collection and monetization opportunity ● Data subscription a major potential future growth angle ● 3rd / 4th gen doors are easy to install and are the only doors that are currently ADA compliant ● Steel swing doors provide an alternative to overhead steel roll-up doors in multi-story self-storage facilities ● Significant presence of 1st and 2nd gen doors that are going to be replaced ● Hallway systems designed with durability and easy installation to complement roll-up doors ● Fully customizable to fit the needs of each customer ● Numerous older facilities requiring upgrades ● Door replacement of pre-existing units ● Enables facilities to renovate without loss of rental income and with assurance of no damage to or theft of tenants’ belongings ● Systematized program that includes video recording and active security guard monitoring ● Reconfiguration of larger units into multiple smaller units to maximize rentable units ● Redevelopment of existing locations to high-end facilities ● Provides consulting services to assist operators in determining optimal mix of facility ● Industry-leading installation services ● Comprehensive offering of additional options, including vision panels, insulation, repair kits, and automated door operators ● Janus typically does 75%+ of the installations for self-storage projects (excluding commercial) Remix / Renovation 33
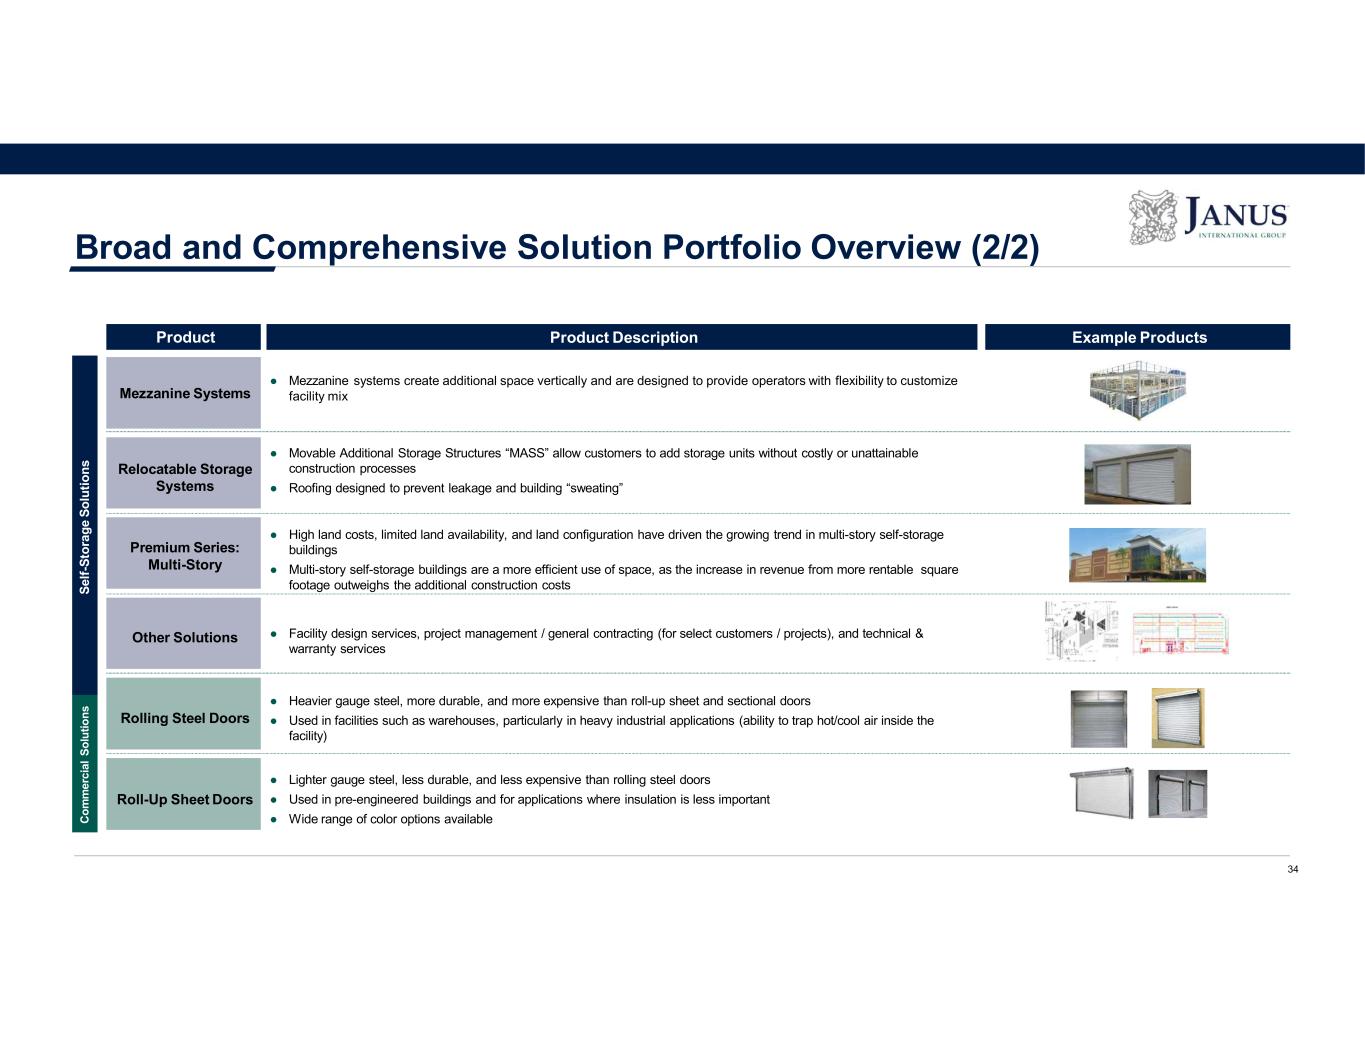
Broad and Comprehensive Solution Portfolio Overview (2/2) Product Product Description Example Products S el f- S to ra g e S o lu ti o n s C o m m er ci al S o lu ti o n s 34 Mezzanine Systems Relocatable Storage Systems ● Mezzanine systems create additional space vertically and are designed to provide operators with flexibility to customize facility mix ● Movable Additional Storage Structures “MASS” allow customers to add storage units without costly or unattainable construction processes ● Roofing designed to prevent leakage and building “sweating” Premium Series: Multi-Story ● High land costs, limited land availability, and land configuration have driven the growing trend in multi-story self-storage buildings ● Multi-story self-storage buildings are a more efficient use of space, as the increase in revenue from more rentable square footage outweighs the additional construction costs Other Solutions ● Facility design services, project management / general contracting (for select customers / projects), and technical & warranty services Rolling Steel Doors ● Heavier gauge steel, more durable, and more expensive than roll-up sheet and sectional doors ● Used in facilities such as warehouses, particularly in heavy industrial applications (ability to trap hot/cool air inside the facility) Roll-Up Sheet Doors ● Lighter gauge steel, less durable, and less expensive than rolling steel doors ● Used in pre-engineered buildings and for applications where insulation is less important ● Wide range of color options available
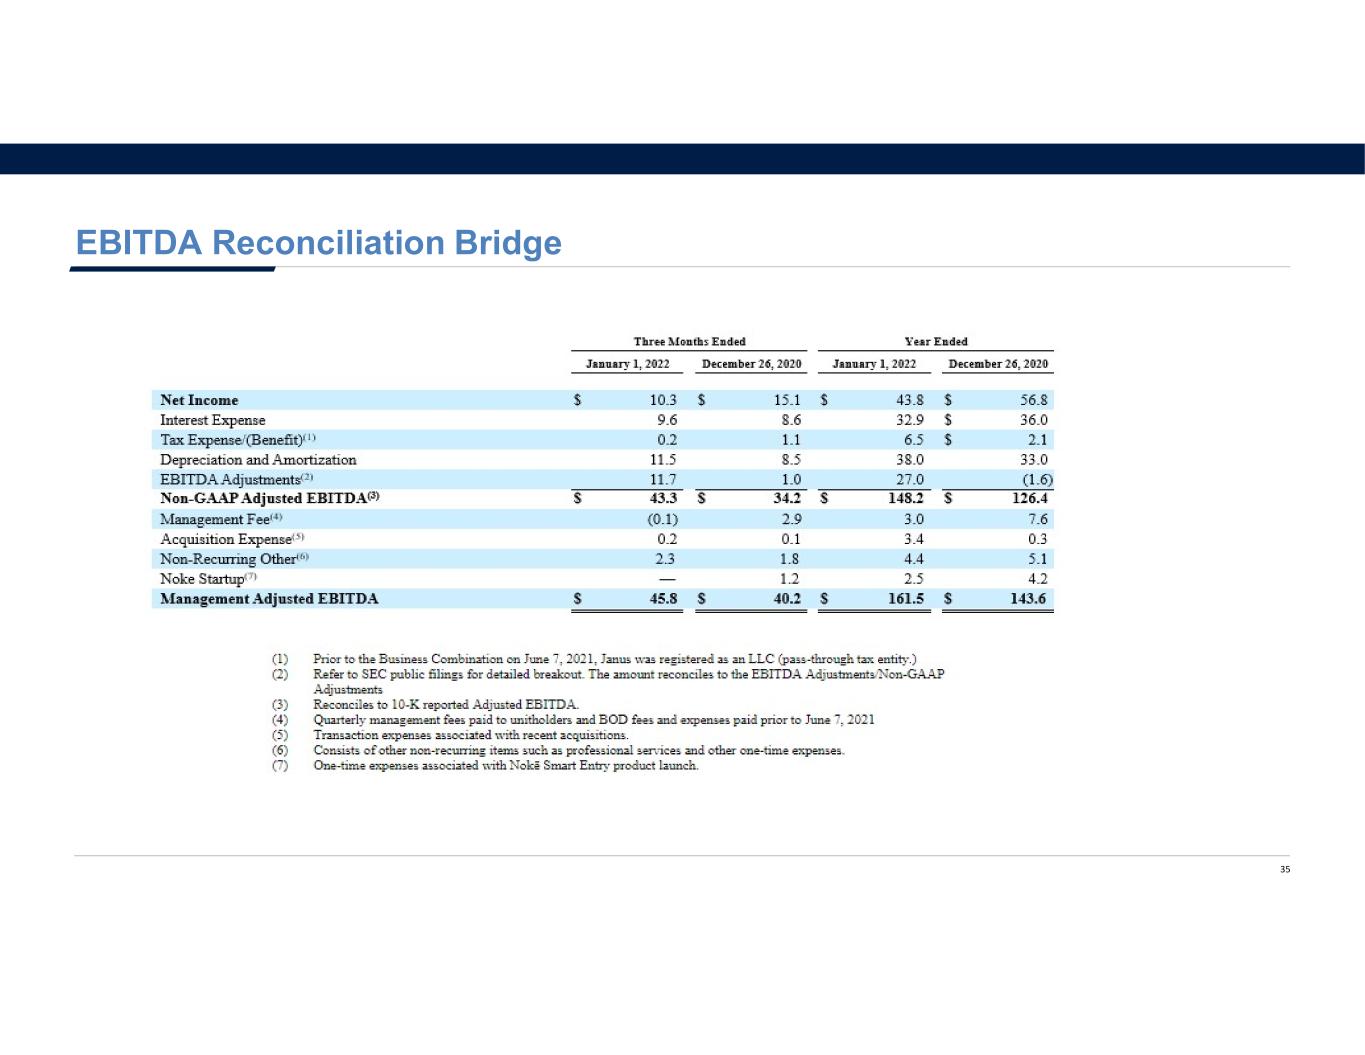
35 EBITDA Reconciliation Bridge
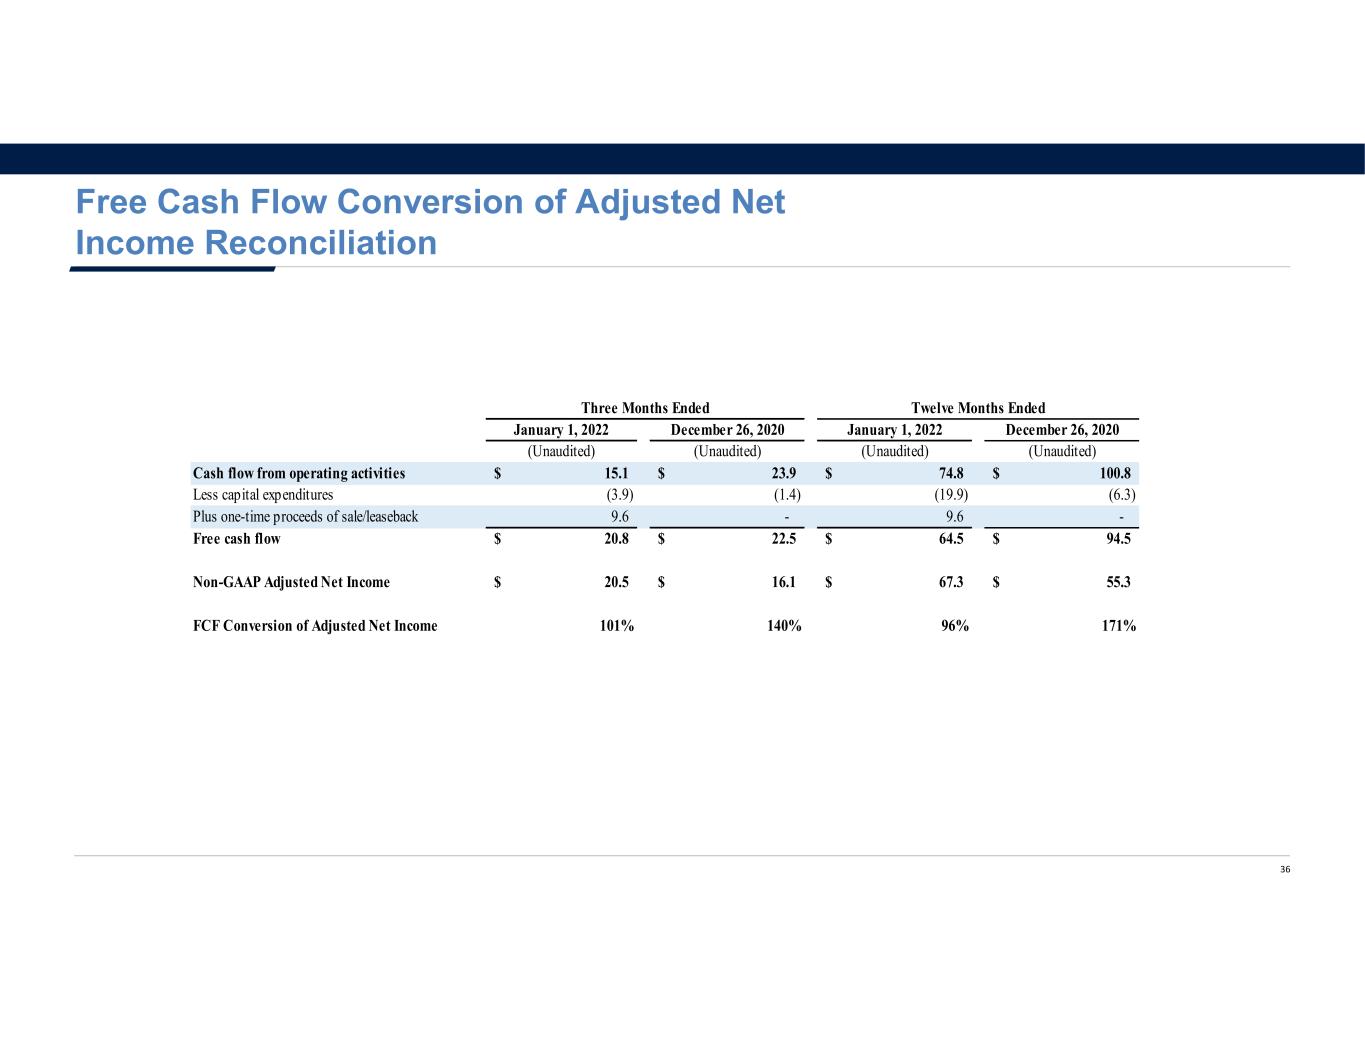
36 Free Cash Flow Conversion of Adjusted Net Income Reconciliation January 1, 2022 December 26, 2020 January 1, 2022 December 26, 2020 (Unaudited) (Unaudited) (Unaudited) (Unaudited) Cash flow from operating activities 15.1$ 23.9$ 74.8$ 100.8$ Less capital expenditures (3.9) (1.4) (19.9) (6.3) Plus one-time proceeds of sale/leaseback 9.6 - 9.6 - Free cash flow 20.8$ 22.5$ 64.5$ 94.5$ Non-GAAP Adjusted Net Income 20.5$ 16.1$ 67.3$ 55.3$ FCF Conversion of Adjusted Net Income 101% 140% 96% 171% Three Months Ended Twelve Months Ended
