Q4 AND FULL YEAR 2022 EARNINGS PRESENTATION & LONG-TERM OUTLOOK March 16, 2023 JanusIntl.com
11 FORWARD LOOKING STATEMENTS Certain statements in this communication, including the estimated guidance provided under “2022 Outlook” herein, may be considered “forward-looking statements” within the meaning of Section 27A of the Securities Act of 1933, as amended, and Section 21E of the Securities Exchange Act of 1934, as amended. All statements other than statements of historical fact included in this communication are forward-looking statements, including, but not limited to statements regarding Janus’s belief regarding the demand outlook for Janus’s products and the strength of the industrials markets. When used in this communication, words such as “may,” “should,” “could,” “would,” “expect,” “plan,” “anticipate,” “believe,” “estimate,” “continue,” or the negative of such terms or other similar expressions, as they relate to the management team, identify forward- looking statements. Such forward-looking statements are based on the current beliefs of Janus’s management, based on currently available information, as to the outcome and timing of future events, and involve factors, risks, and uncertainties that may cause actual results in future periods to differ materially from such statements. In addition to factors previously disclosed in Janus’s reports filed with the SEC and those identified elsewhere in this communication, the following factors, among others, could cause actual results to differ materially from forward-looking statements or historical performance: (i) risks of the self-storage industry; (ii) the highly competitive nature of the self- storage industry and Janus’s ability to compete therein; (iii) litigation, complaints, and/or adverse publicity; (iv) cyber incidents or directed attacks that could result in information theft, data corruption, operational disruption and/or financial loss; and (v) the risk that the demand outlook for Janus’s products may not be as strong as anticipated. There can be no assurance that the events, results, trends or guidance regarding financial outlook identified in these forward-looking statements will occur or be achieved. Forward-looking statements speak only as of the date they are made, and Janus is not under any obligation and expressly disclaims any obligation, to update, alter or otherwise revise any forward-looking statement, whether as a result of new information, future events or otherwise, except as required by law. This communication is not intended to be all-inclusive or to contain all the information that a person may desire in considering an investment in Janus and is not intended to form the basis of an investment decision in Janus. All subsequent written and oral forward-looking statements concerning Janus or other matters and attributable to Janus or any person acting on its behalf are expressly qualified in their entirety by the cautionary statements above and under the heading “Risk Factors” in Janus’s most recently filed Annual Report on Form 10-K and Quarterly Report on Form 10-Q, as updated from time to time in amendments and its subsequent filings with the SEC.
22 NON-GAAP FINANCIAL MEASURES In this presentation Janus uses measures of performance that are not required by or presented in accordance with GAAP in the United States. Non-GAAP financial performance measures are used to supplement the financial information presented on a GAAP basis. These non-GAAP financial measures should not be considered in isolation or as a substitute for the relevant GAAP measures and should be read in conjunction with information presented on a GAAP basis. Adjusted EBITDA, and Adjusted Net Income, Adjusted Basic EPS, and Adjusted Diluted EPS are non-GAAP financial measures used by Janus to evaluate its operating performance, generate future operating plans, and make strategic decisions, including those relating to operating expenses and the allocation of internal resources. Accordingly, Janus believes Adjusted EBITDA, and Adjusted Net Income, Adjusted Basic EPS, and Adjusted Diluted EPS provide useful information to investors and others in understanding and evaluating Janus’s operating results in the same manner as its management and board of directors and in comparison with Janus’s peer group companies. In addition, Adjusted EBITDA, and Adjusted Net Income, Adjusted Basic EPS, and Adjusted Diluted EPS provide useful measures for period-to-period comparisons of Janus’s business, as they remove the effect of certain non-recurring events and other non-recurring charges, such as acquisitions, and certain variable or non-recurring charges. Adjusted EBITDA is defined as net income excluding interest expense, income taxes, depreciation expense, amortization, and other non-operational, non-recurring items. Adjusted Net Income is defined as net income plus the corresponding tax-adjusted add-backs shown in the Adjusted EBITDA reconciliation. Adjusted Basic earnings (income) per share (EPS) is computed by taking Adjusted Net Income divided by the weighted average number of shares of common stock outstanding during the period. Adjusted Diluted earnings (income) per share (EPS) is computed by dividing Adjusted Net Income by the weighted average number of common shares outstanding plus the effect of dilutive potential common shares outstanding during the period using the treasury stock method. Dilutive potential common shares include stock purchase warrants and contingently issuable shares attributable to the earn-out consideration. Please note that the Company has not provided the most directly comparable GAAP financial measure, or a quantitative reconciliation thereto, for the Adjusted EBITDA forward-looking guidance for 2023 included in this communication in reliance on the "unreasonable efforts" exception provided under Item 10(e)(1)(i)(B) of Regulation S-K. Providing the most directly comparable GAAP financial measure, or a quantitative reconciliation thereto, cannot be done without unreasonable effort due to the inherent uncertainty and difficulty in predicting certain non-cash, material and/or non-recurring expenses or benefits; legal settlements or other matters; and certain tax positions. Because these adjustments are inherently variable and uncertain and depend on various factors that are beyond the Company's control, the Company is also unable to predict their probable significance. The variability of these items could have an unpredictable, and potentially significant, impact on our future GAAP financial results. Adjusted EBITDA, and Adjusted Net Income, Adjusted Basic EPS, and Adjusted Diluted EPS should not be considered in isolation of, or as an alternative to, measures prepared in accordance with GAAP. There are a number of limitations related to the use of Adjusted EBITDA, and Adjusted Net Income, Adjusted Basic EPS, and Adjusted Diluted EPS rather than net income (loss), which is the nearest GAAP equivalent of Adjusted EBITDA and Adjusted Net Income, or Basic EPS and Diluted EPS, which is the nearest equivalent to Adjusted Basic EPS and Adjusted Diluted EPS. These limitations include that the non-GAAP financial measures: (i) exclude depreciation and amortization, and although these are non-cash expenses, the assets being depreciated may be replaced in the future; (ii) do not reflect interest expense, or the cash requirements necessary to service interest on debt, which reduces cash available; (iii) do not reflect the provision for or benefit from income tax that may result in payments that reduce cash available; (iv) exclude non-recurring items (i.e., the extinguishment of debt); and (v) and may not be comparable to similar non-GAAP financial measures used by other companies, because the expenses and other items that Janus excludes in the calculation of these non-GAAP financial measures may differ from the expenses and other items, if any, that other companies may exclude from these non-GAAP financial measures when they report their operating results. Because of these limitations, these non-GAAP financial measures should be considered along with other operating and financial performance measures presented in accordance with GAAP.

3 AGENDA 3 Ramey Jackson Chief Executive Officer 2022 Business Overview & Long-Term Strategic Outlook Anselm Wong Chief Financial Officer 2022 Financial Overview & Long-Term Financial Outlook
4 Q4 / FULL YEAR 2022 & 2023 GUIDANCE OVERVIEW
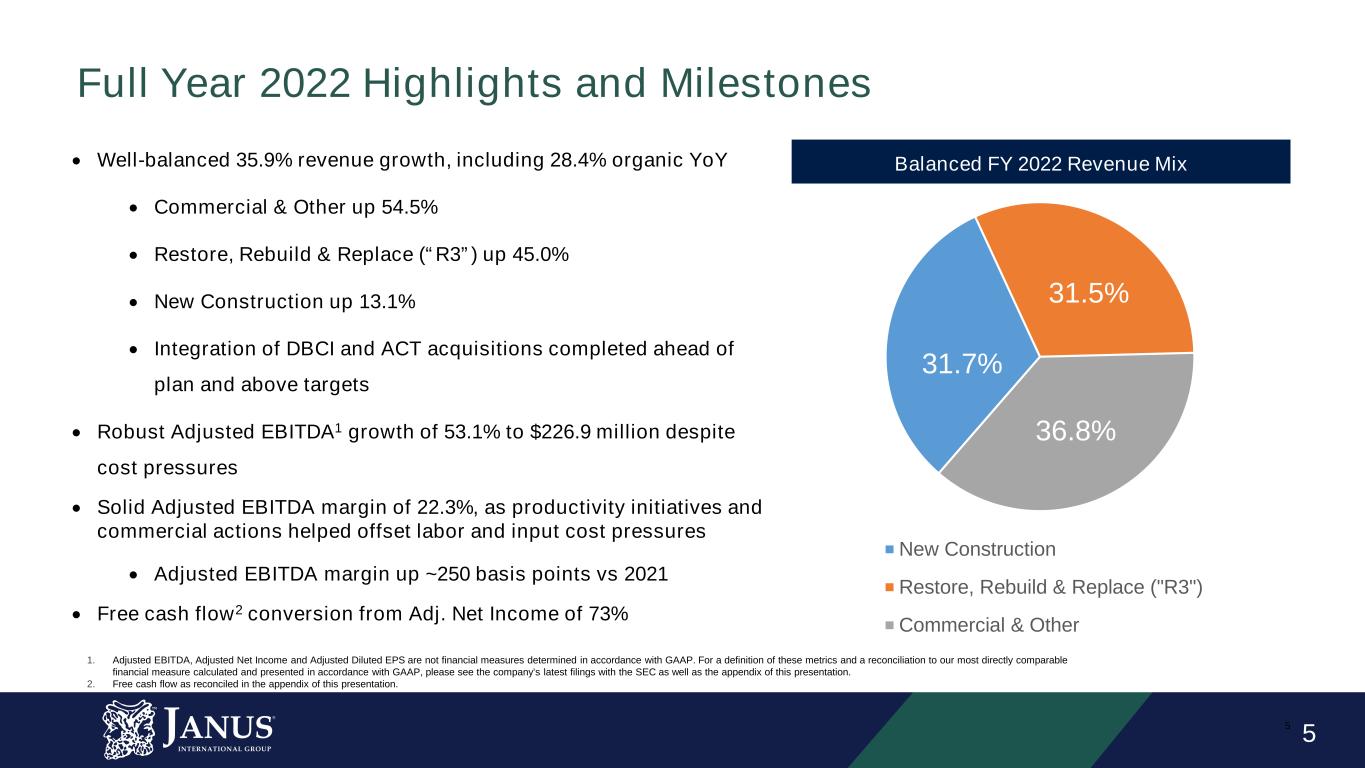
55 • Well-balanced 35.9% revenue growth, including 28.4% organic YoY • Commercial & Other up 54.5% • Restore, Rebuild & Replace (“R3”) up 45.0% • New Construction up 13.1% • Integration of DBCI and ACT acquisitions completed ahead of plan and above targets • Robust Adjusted EBITDA1 growth of 53.1% to $226.9 million despite cost pressures • Solid Adjusted EBITDA margin of 22.3%, as productivity initiatives and commercial actions helped offset labor and input cost pressures • Adjusted EBITDA margin up ~250 basis points vs 2021 • Free cash flow2 conversion from Adj. Net Income of 73% Balanced FY 2022 Revenue Mix 31.7% 31.5% 36.8% New Construction Restore, Rebuild & Replace ("R3") Commercial & Other Full Year 2022 Highlights and Milestones 1. Adjusted EBITDA, Adjusted Net Income and Adjusted Diluted EPS are not financial measures determined in accordance with GAAP. For a definition of these metrics and a reconciliation to our most directly comparable financial measure calculated and presented in accordance with GAAP, please see the company’s latest filings with the SEC as well as the appendix of this presentation. 2. Free cash flow as reconciled in the appendix of this presentation.
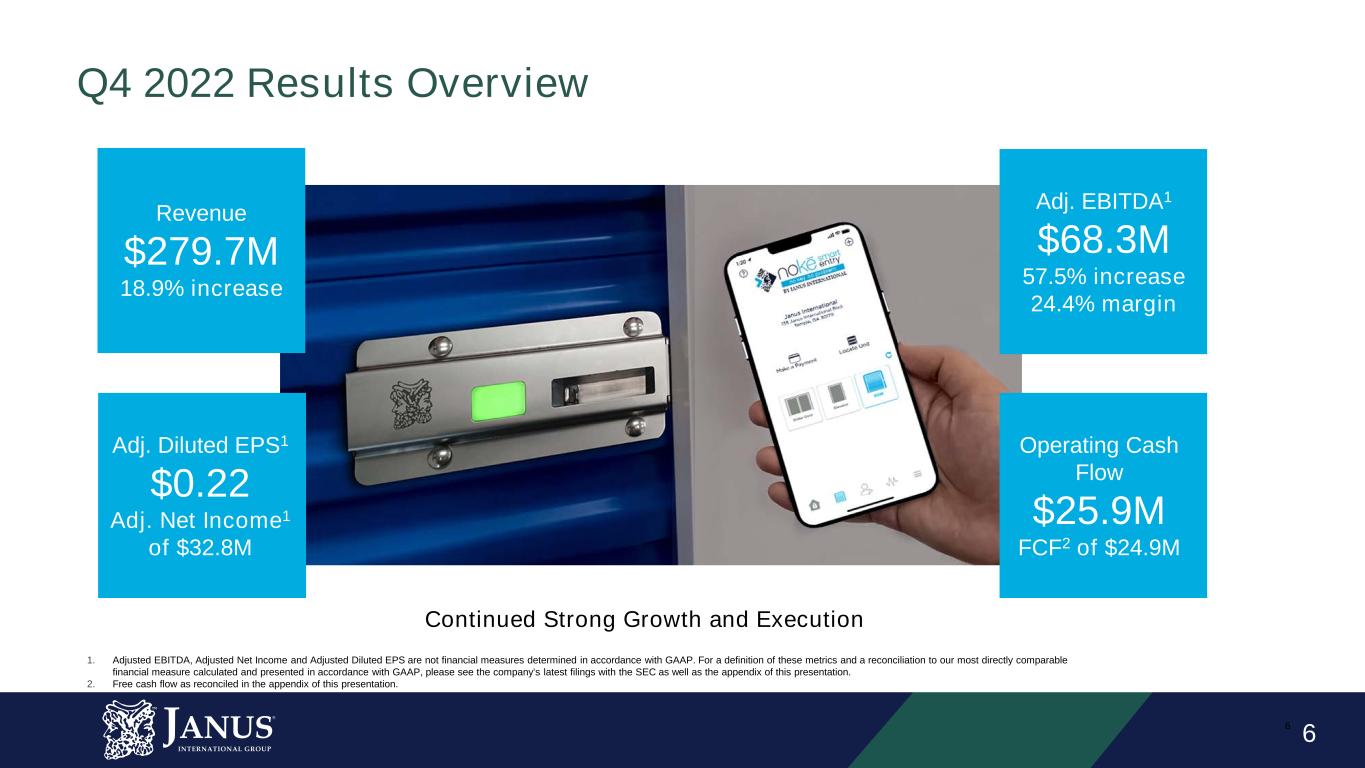
66 1. Adjusted EBITDA, Adjusted Net Income and Adjusted Diluted EPS are not financial measures determined in accordance with GAAP. For a definition of these metrics and a reconciliation to our most directly comparable financial measure calculated and presented in accordance with GAAP, please see the company’s latest filings with the SEC as well as the appendix of this presentation. 2. Free cash flow as reconciled in the appendix of this presentation. Adj. EBITDA1 $68.3M 57.5% increase 24.4% margin Revenue $279.7M 18.9% increase Adj. Diluted EPS1 $0.22 Adj. Net Income1 of $32.8M Operating Cash Flow $25.9M FCF2 of $24.9M Q4 2022 Results Overview Continued Strong Growth and Execution
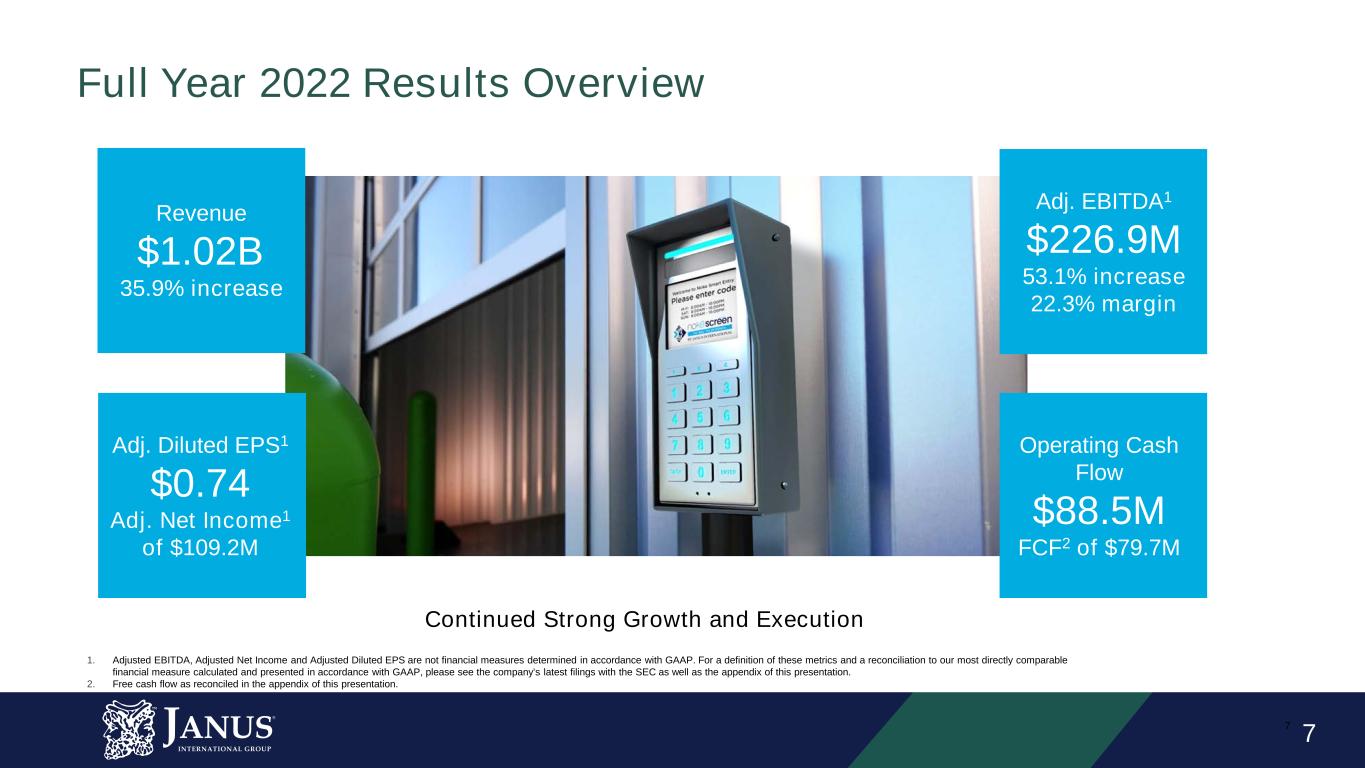
77 Continued Strong Growth and Execution Adj. EBITDA1 $226.9M 53.1% increase 22.3% margin Revenue $1.02B 35.9% increase Adj. Diluted EPS1 $0.74 Adj. Net Income1 of $109.2M Operating Cash Flow $88.5M FCF2 of $79.7M Full Year 2022 Results Overview 1. Adjusted EBITDA, Adjusted Net Income and Adjusted Diluted EPS are not financial measures determined in accordance with GAAP. For a definition of these metrics and a reconciliation to our most directly comparable financial measure calculated and presented in accordance with GAAP, please see the company’s latest filings with the SEC as well as the appendix of this presentation. 2. Free cash flow as reconciled in the appendix of this presentation.
88 • Strong full year organic growth driven by balanced strength in all sales channels, bolstered by contributions from the DBCI and ACT acquisitions • Commercial and productivity initiatives helping drive top line growth, offsetting higher costs • ~250 bps improvement in Adj. EBITDA1 margin YoY • Integration of DBCI and ACT strategic acquisitions now complete with synergies realized above expectations • Meaningful cash generation; 2022 free cash flow2 conversion of Adjusted Net Income1 of 73% • Year-end net leverage ratio3 of 2.8x – down 1.6x from year end 2021 and within target range 2022 Summary 1. Adjusted EBITDA, Adjusted Net Income and Adjusted Diluted EPS are not financial measures determined in accordance with GAAP. For a definition of these metrics and a reconciliation to our most directly comparable financial measure calculated and presented in accordance with GAAP, please see the company’s latest filings with the SEC as well as the appendix of this presentation. 2. Free cash flow as reconciled in the appendix of this presentation. 3. Net leverage defined as (total debt – cash and cash equivalents)/TTM adjusted EBITDA.
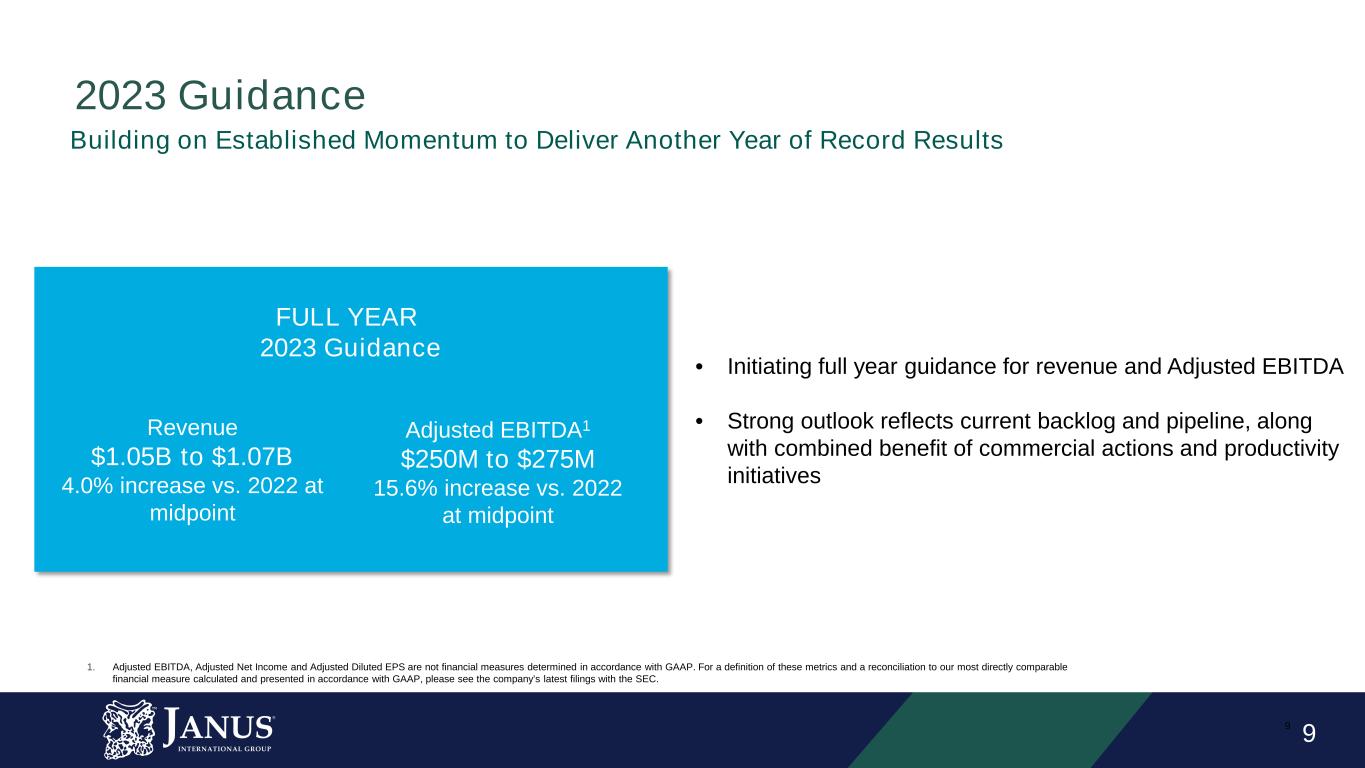
99 2023 Guidance FULL YEAR 2023 Guidance Revenue $1.05B to $1.07B 4.0% increase vs. 2022 at midpoint Adjusted EBITDA1 $250M to $275M 15.6% increase vs. 2022 at midpoint • Initiating full year guidance for revenue and Adjusted EBITDA • Strong outlook reflects current backlog and pipeline, along with combined benefit of commercial actions and productivity initiatives Building on Established Momentum to Deliver Another Year of Record Results 1. Adjusted EBITDA, Adjusted Net Income and Adjusted Diluted EPS are not financial measures determined in accordance with GAAP. For a definition of these metrics and a reconciliation to our most directly comparable financial measure calculated and presented in accordance with GAAP, please see the company’s latest filings with the SEC.

10 10 LONG-TERM STRATEGIC OUTLOOK
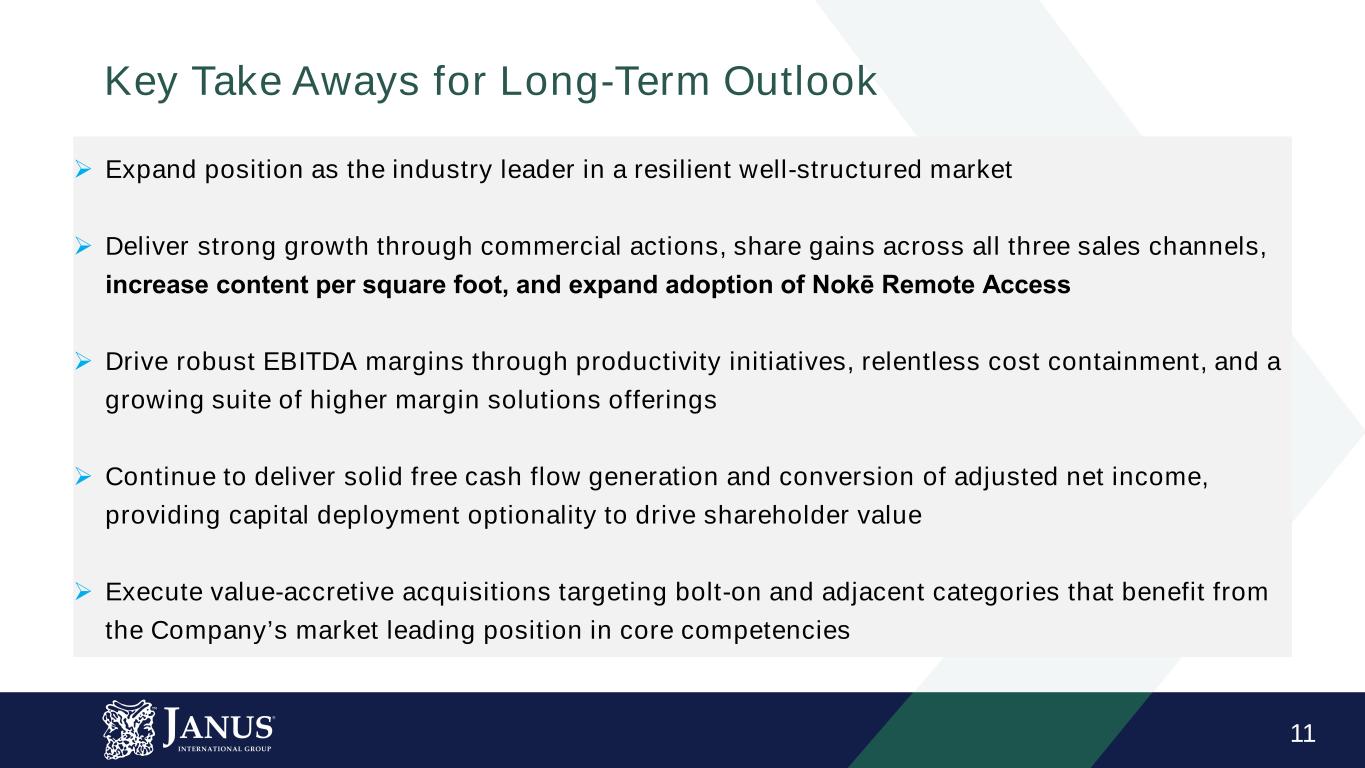
11 Key Take Aways for Long-Term Outlook Expand position as the industry leader in a resilient well-structured market Deliver strong growth through commercial actions, share gains across all three sales channels, increase content per square foot, and expand adoption of Nokē Remote Access Drive robust EBITDA margins through productivity initiatives, relentless cost containment, and a growing suite of higher margin solutions offerings Continue to deliver solid free cash flow generation and conversion of adjusted net income, providing capital deployment optionality to drive shareholder value Execute value-accretive acquisitions targeting bolt-on and adjacent categories that benefit from the Company’s market leading position in core competencies
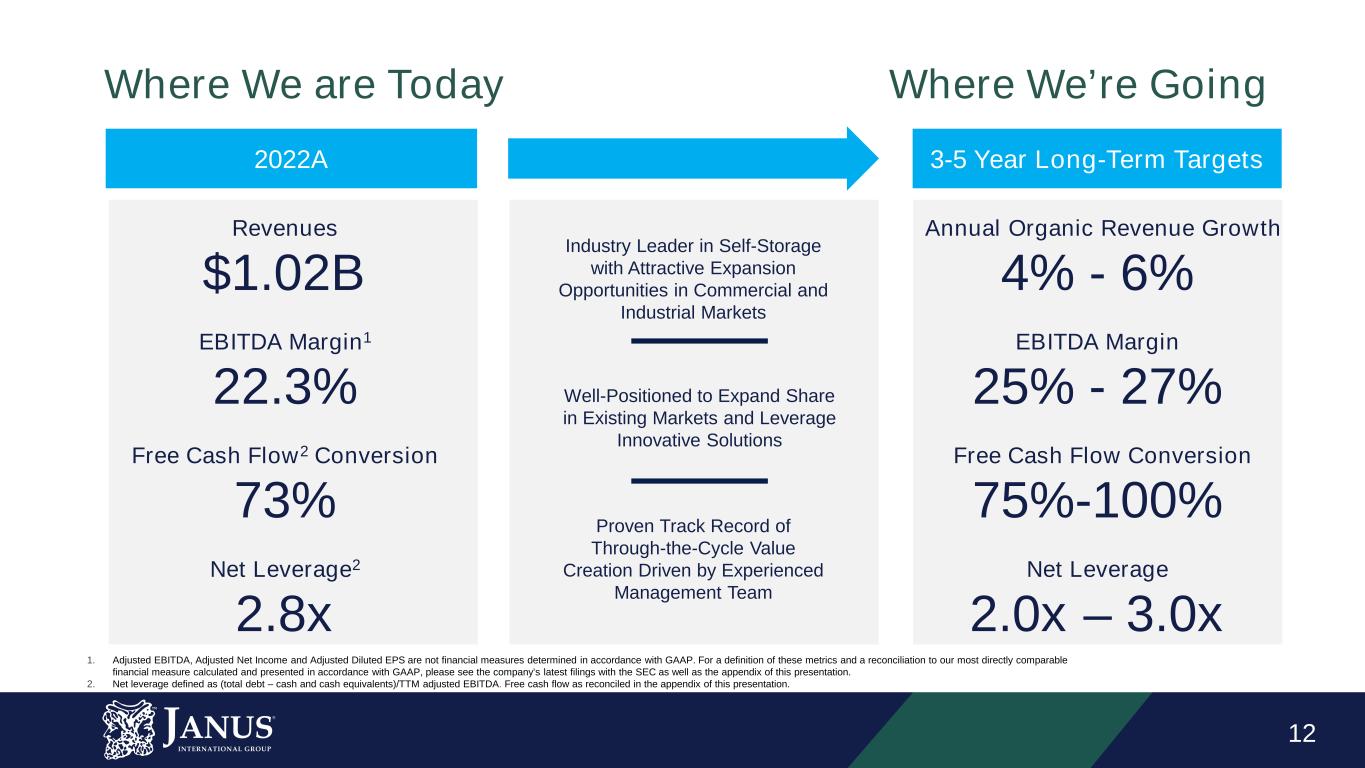
12 2022A 3-5 Year Long-Term Targets Where We are Today Where We’re Going Revenues $1.02B EBITDA Margin1 22.3% Net Leverage2 2.8x Industry Leader in Self-Storage with Attractive Expansion Opportunities in Commercial and Industrial Markets Well-Positioned to Expand Share in Existing Markets and Leverage Innovative Solutions Proven Track Record of Through-the-Cycle Value Creation Driven by Experienced Management Team 1. Adjusted EBITDA, Adjusted Net Income and Adjusted Diluted EPS are not financial measures determined in accordance with GAAP. For a definition of these metrics and a reconciliation to our most directly comparable financial measure calculated and presented in accordance with GAAP, please see the company’s latest filings with the SEC as well as the appendix of this presentation. 2. Net leverage defined as (total debt – cash and cash equivalents)/TTM adjusted EBITDA. Free cash flow as reconciled in the appendix of this presentation. Free Cash Flow2 Conversion 73% Annual Organic Revenue Growth 4% - 6% EBITDA Margin 25% - 27% Net Leverage 2.0x – 3.0x Free Cash Flow Conversion 75%-100%
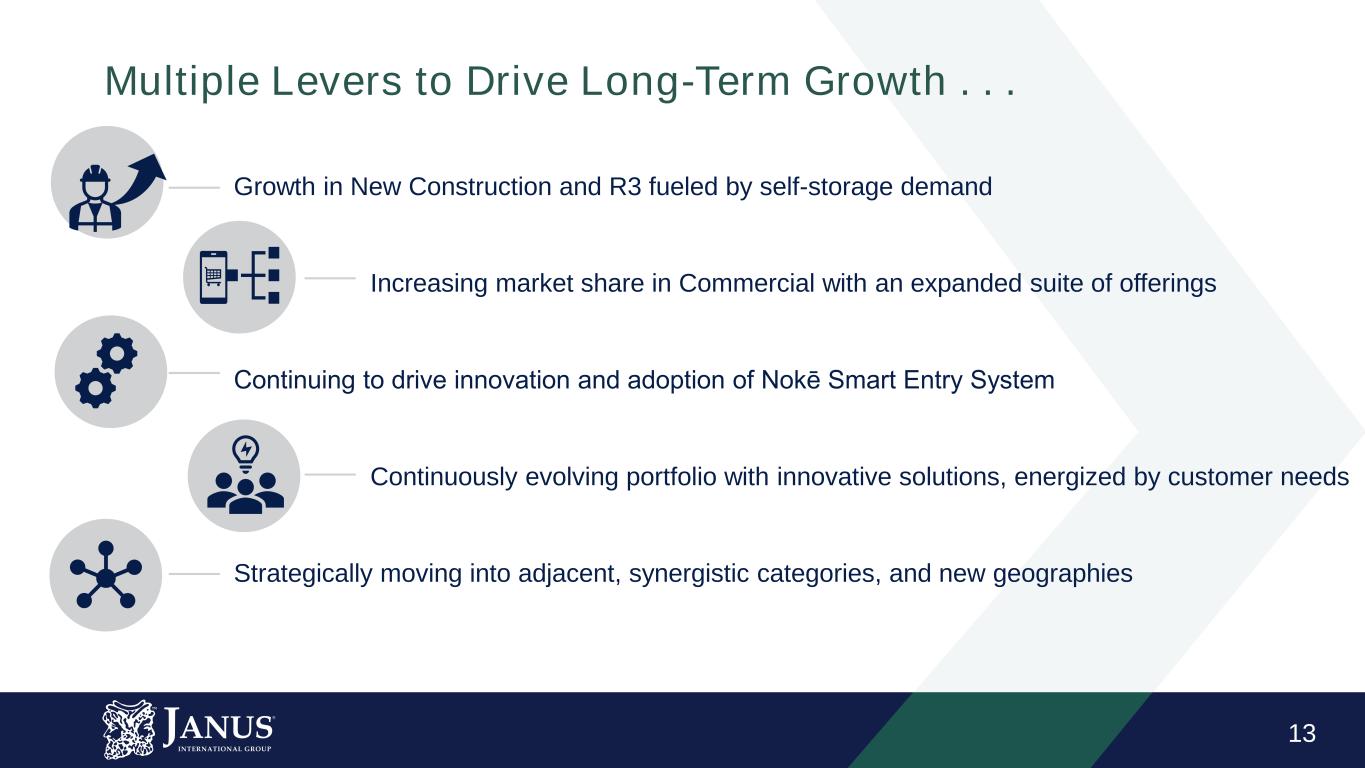
13 Growth in New Construction and R3 fueled by self-storage demand Increasing market share in Commercial with an expanded suite of offerings Continuing to drive innovation and adoption of Nokē Smart Entry System Continuously evolving portfolio with innovative solutions, energized by customer needs Strategically moving into adjacent, synergistic categories, and new geographies Multiple Levers to Drive Long-Term Growth . . .
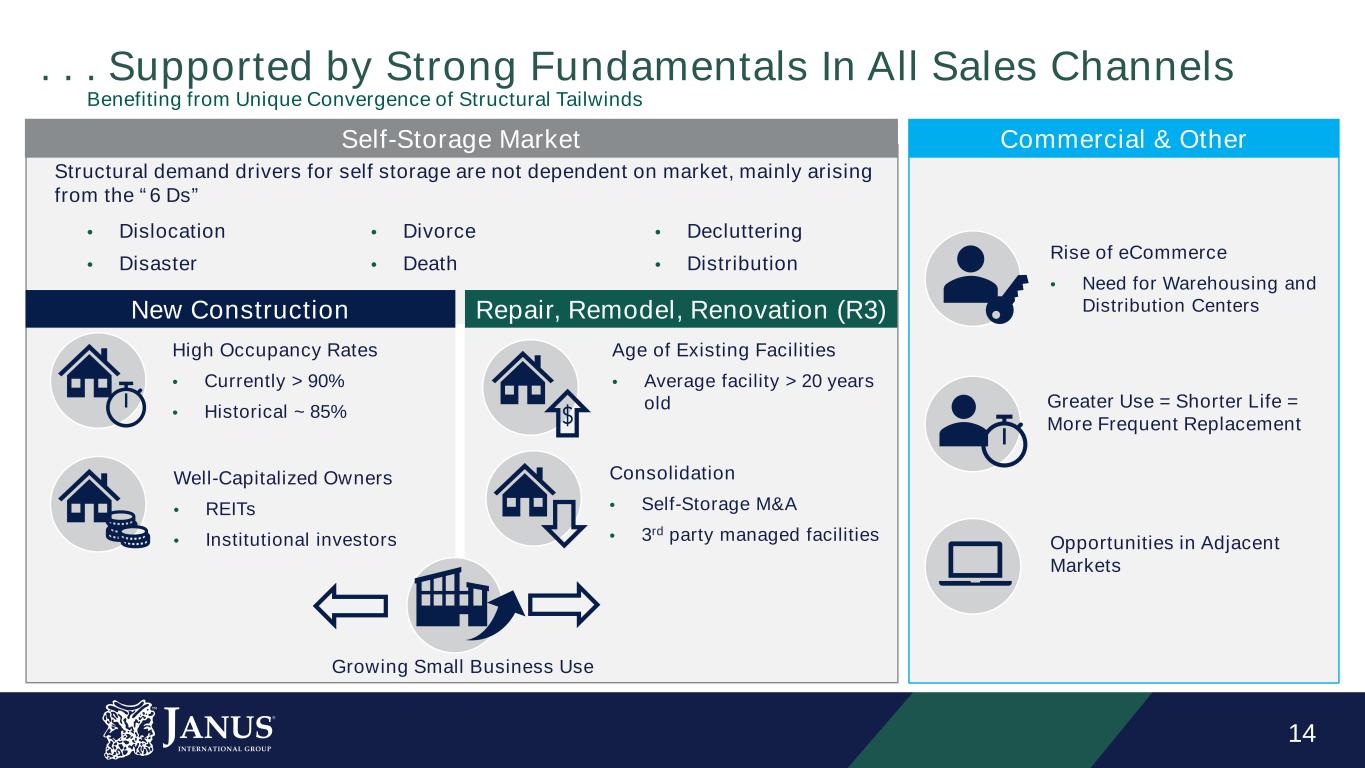
14 . . . Supported by Strong Fundamentals In All Sales Channels Commercial & Other New Construction Repair, Remodel, Renovation (R3) Benefiting from Unique Convergence of Structural Tailwinds High Occupancy Rates • Currently > 90% • Historical ~ 85% Well-Capitalized Owners • REITs • Institutional investors Age of Existing Facilities • Average facility > 20 years old Rise of eCommerce • Need for Warehousing and Distribution Centers Greater Use = Shorter Life = More Frequent Replacement Opportunities in Adjacent Markets Consolidation • Self-Storage M&A • 3rd party managed facilities Self-Storage Market Structural demand drivers for self storage are not dependent on market, mainly arising from the “6 Ds” • Dislocation • Disaster • Divorce • Death • Decluttering • Distribution Growing Small Business Use
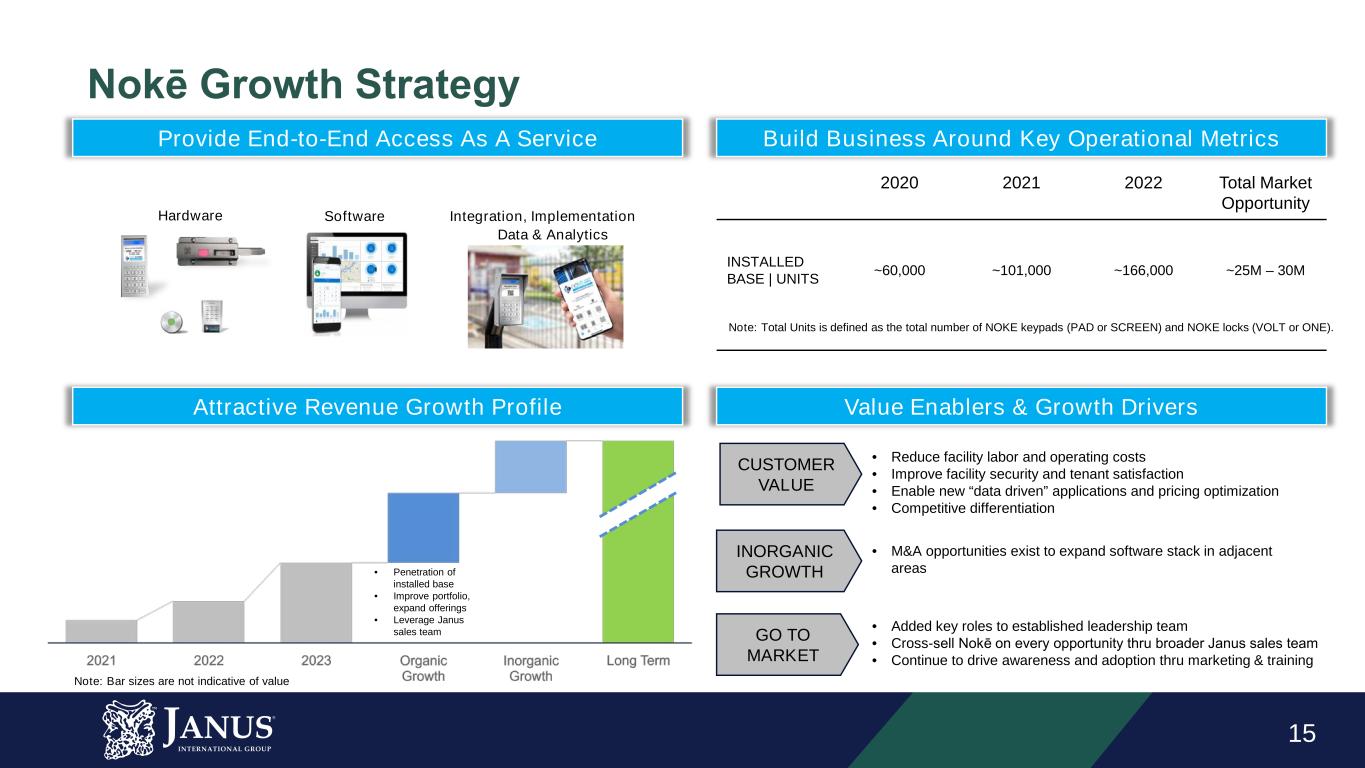
15 Nokē Growth Strategy Note: Bar sizes are not indicative of value Software Integration, Implementation Data & Analytics Provide End-to-End Access As A Service Hardware Build Business Around Key Operational Metrics Attractive Revenue Growth Profile Value Enablers & Growth Drivers CUSTOMER VALUE GO TO MARKET • Reduce facility labor and operating costs • Improve facility security and tenant satisfaction • Enable new “data driven” applications and pricing optimization • Competitive differentiation • Penetration of installed base • Improve portfolio, expand offerings • Leverage Janus sales team 2020 2021 2022 Total Market Opportunity INSTALLED BASE | UNITS ~60,000 ~101,000 ~166,000 ~25M – 30M • M&A opportunities • Added key roles to established leadership team • Cross-sell Nokē on every opportunity thru broader Janus sales team • Continue to drive awareness and adoption thru marketing & training INORGANIC GROWTH • M&A opportunities exist to expand software stack in adjacent areas Note: Total Units is defined as the total number of NOKE keypads (PAD or SCREEN) and NOKE locks (VOLT or ONE).
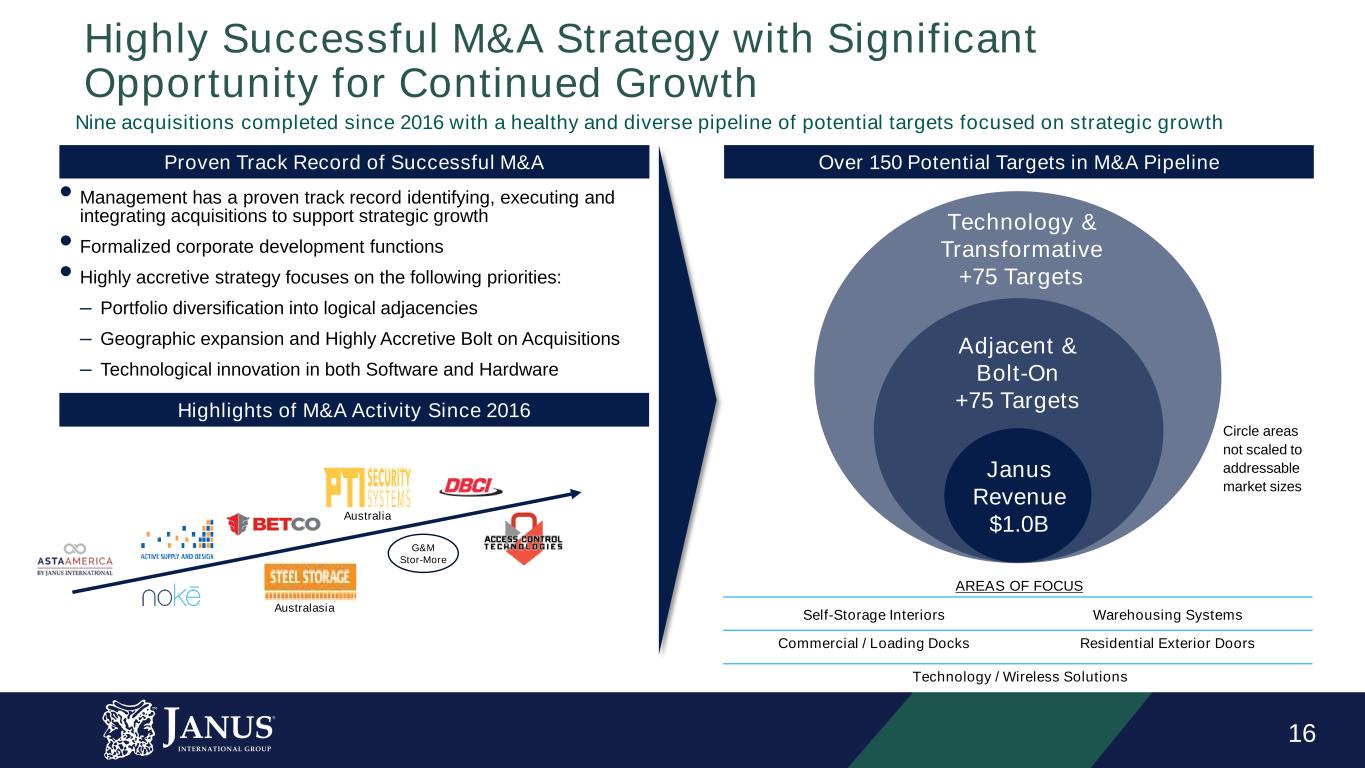
16 Highly Successful M&A Strategy with Significant Opportunity for Continued Growth Proven Track Record of Successful M&A Over 150 Potential Targets in M&A Pipeline • Management has a proven track record identifying, executing and integrating acquisitions to support strategic growth • Formalized corporate development functions • Highly accretive strategy focuses on the following priorities: – Portfolio diversification into logical adjacencies – Geographic expansion and Highly Accretive Bolt on Acquisitions – Technological innovation in both Software and Hardware Highlights of M&A Activity Since 2016 Nine acquisitions completed since 2016 with a healthy and diverse pipeline of potential targets focused on strategic growth Technology & Transformative +75 Targets Adjacent & Bolt-On +75 Targets Janus Revenue $1.0B AREAS OF FOCUS Self-Storage Interiors Warehousing Systems Commercial / Loading Docks Residential Exterior Doors Technology / Wireless Solutions Circle areas not scaled to addressable market sizes Australasia Australia G&M Stor-More

17 17 LONG-TERM FINANCIAL OUTLOOK
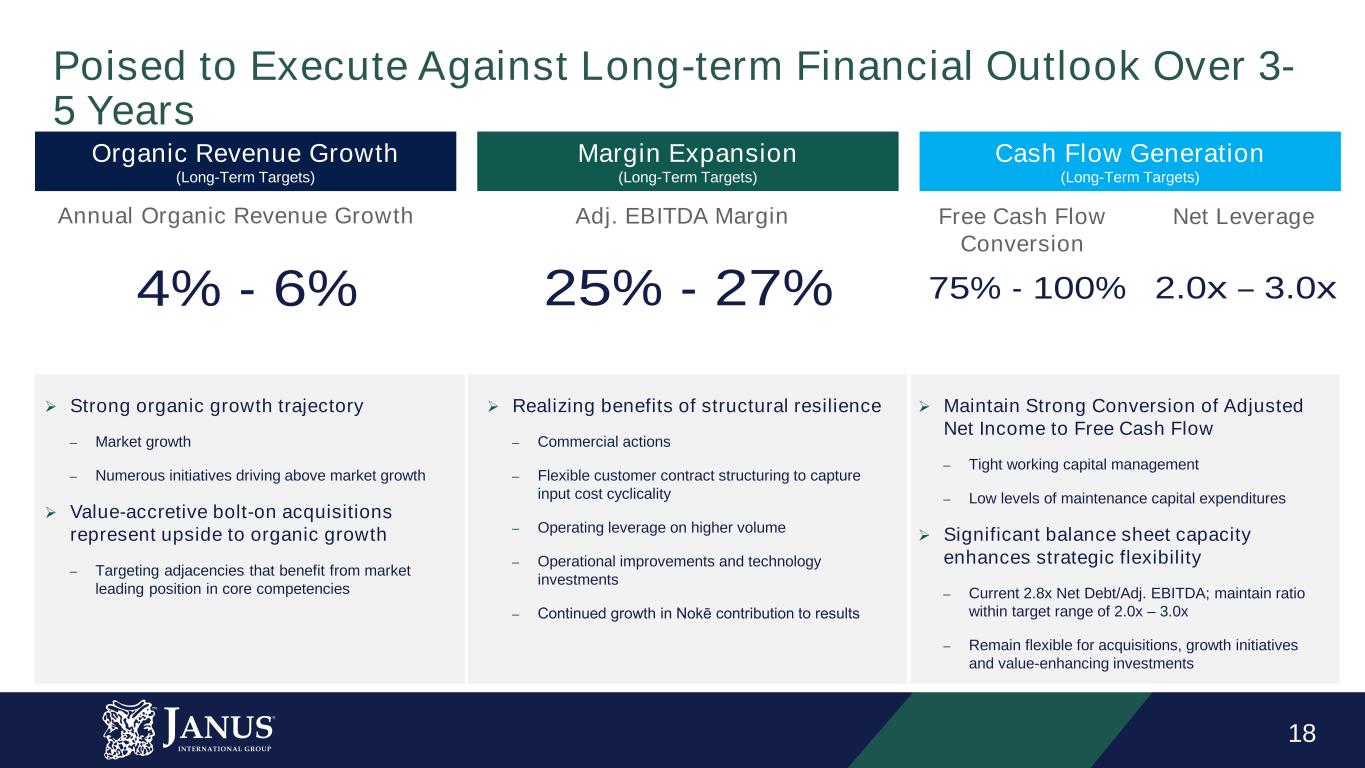
18 2.0x – 3.0x75% - 100% Cash Flow Generation (Long-Term Targets) Organic Revenue Growth (Long-Term Targets) Strong organic growth trajectory ‒ Market growth ‒ Numerous initiatives driving above market growth Value-accretive bolt-on acquisitions represent upside to organic growth ‒ Targeting adjacencies that benefit from market leading position in core competencies Realizing benefits of structural resilience ‒ Commercial actions ‒ Flexible customer contract structuring to capture input cost cyclicality ‒ Operating leverage on higher volume ‒ Operational improvements and technology investments ‒ Continued growth in Nokē contribution to results Maintain Strong Conversion of Adjusted Net Income to Free Cash Flow ‒ Tight working capital management ‒ Low levels of maintenance capital expenditures Significant balance sheet capacity enhances strategic flexibility ‒ Current 2.8x Net Debt/Adj. EBITDA; maintain ratio within target range of 2.0x – 3.0x ‒ Remain flexible for acquisitions, growth initiatives and value-enhancing investments Margin Expansion (Long-Term Targets) Annual Organic Revenue Growth Adj. EBITDA Margin Free Cash Flow Conversion Net Leverage 4% - 6% Poised to Execute Against Long-term Financial Outlook Over 3- 5 Years 25% - 27%
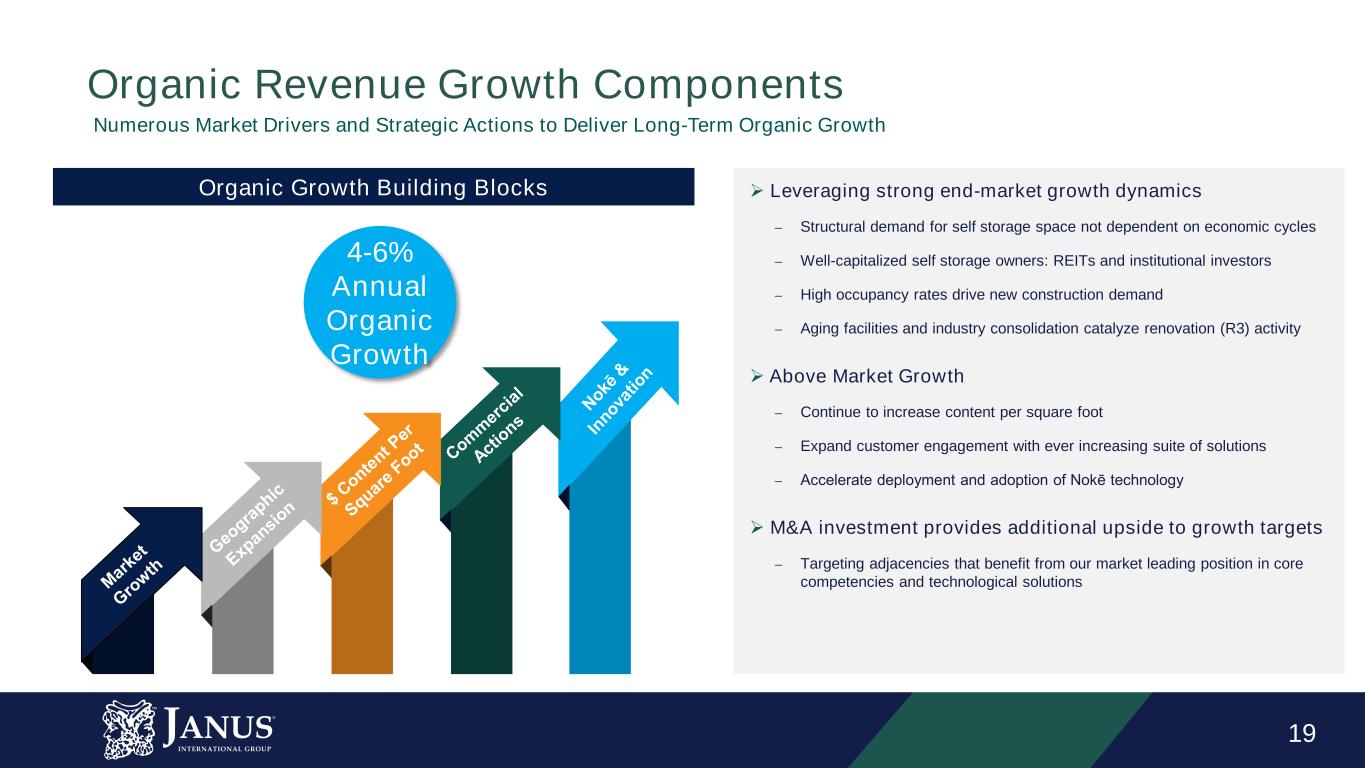
19 Organic Revenue Growth Components Numerous Market Drivers and Strategic Actions to Deliver Long-Term Organic Growth Leveraging strong end-market growth dynamics ‒ Structural demand for self storage space not dependent on economic cycles ‒ Well-capitalized self storage owners: REITs and institutional investors ‒ High occupancy rates drive new construction demand ‒ Aging facilities and industry consolidation catalyze renovation (R3) activity Above Market Growth ‒ Continue to increase content per square foot ‒ Expand customer engagement with ever increasing suite of solutions ‒ Accelerate deployment and adoption of Nokē technology M&A investment provides additional upside to growth targets ‒ Targeting adjacencies that benefit from our market leading position in core competencies and technological solutions Organic Growth Building Blocks 4-6% Annual Organic Growth
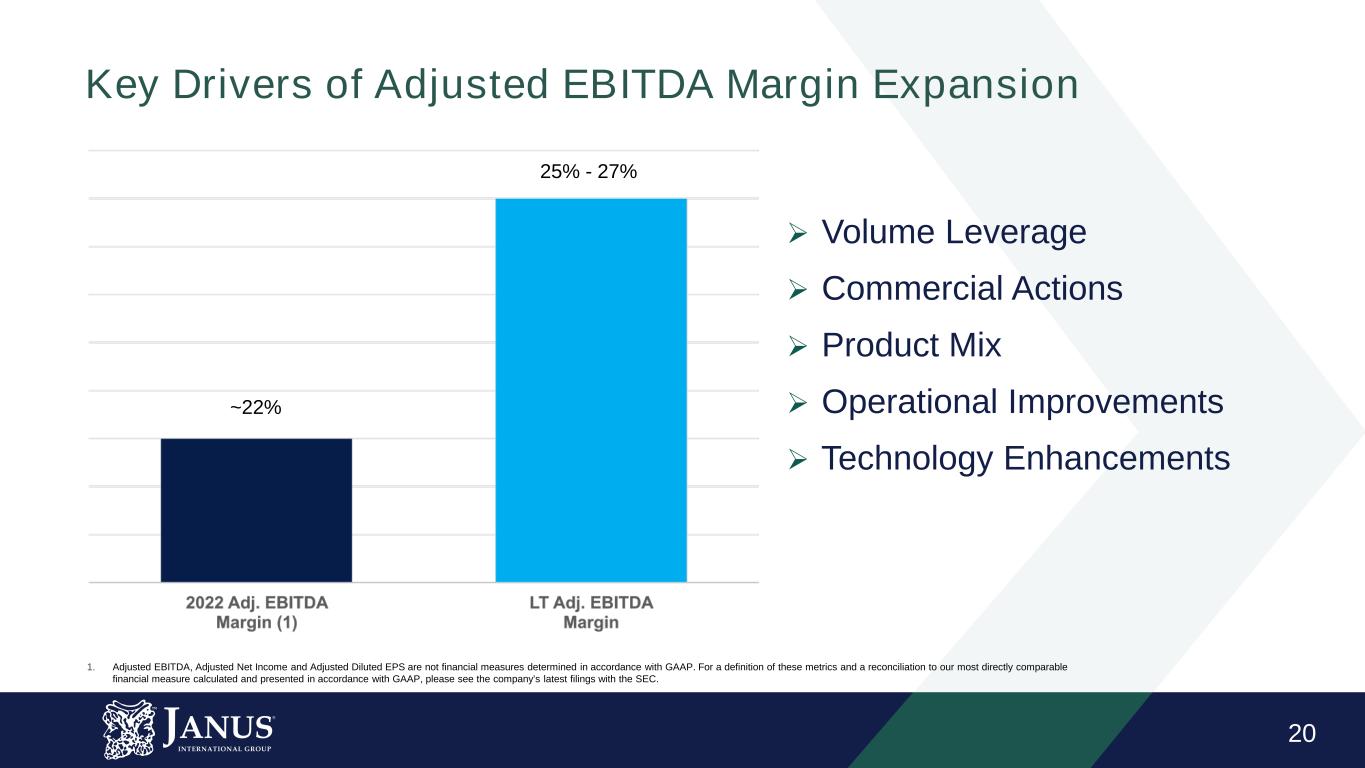
20 Key Drivers of Adjusted EBITDA Margin Expansion ~22% 25% - 27% 1. Adjusted EBITDA, Adjusted Net Income and Adjusted Diluted EPS are not financial measures determined in accordance with GAAP. For a definition of these metrics and a reconciliation to our most directly comparable financial measure calculated and presented in accordance with GAAP, please see the company’s latest filings with the SEC. Volume Leverage Commercial Actions Product Mix Operational Improvements Technology Enhancements
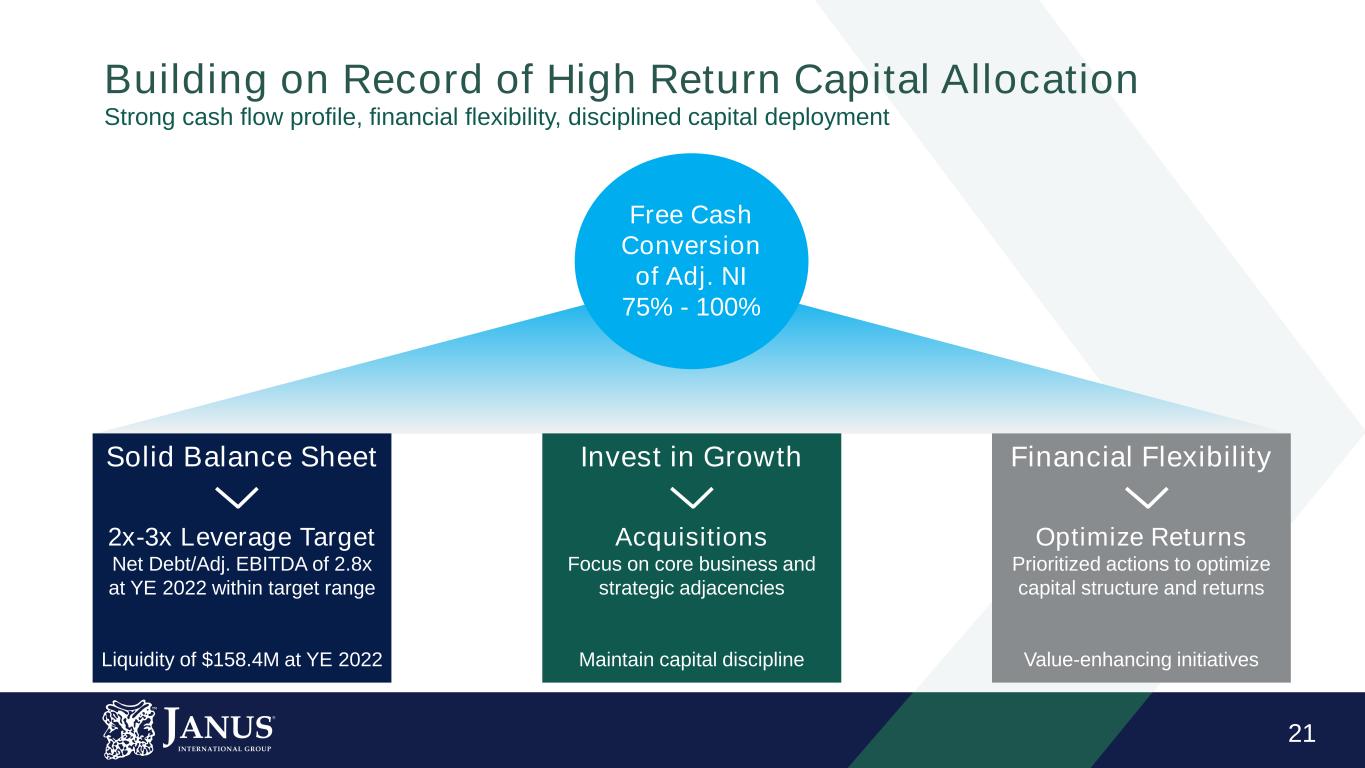
21 Solid Balance Sheet 2x-3x Leverage Target Net Debt/Adj. EBITDA of 2.8x at YE 2022 within target range Liquidity of $158.4M at YE 2022 Financial Flexibility Optimize Returns Prioritized actions to optimize capital structure and returns Value-enhancing initiatives Free Cash Conversion of Adj. NI 75% - 100% Invest in Growth Acquisitions Focus on core business and strategic adjacencies Maintain capital discipline Building on Record of High Return Capital Allocation Strong cash flow profile, financial flexibility, disciplined capital deployment
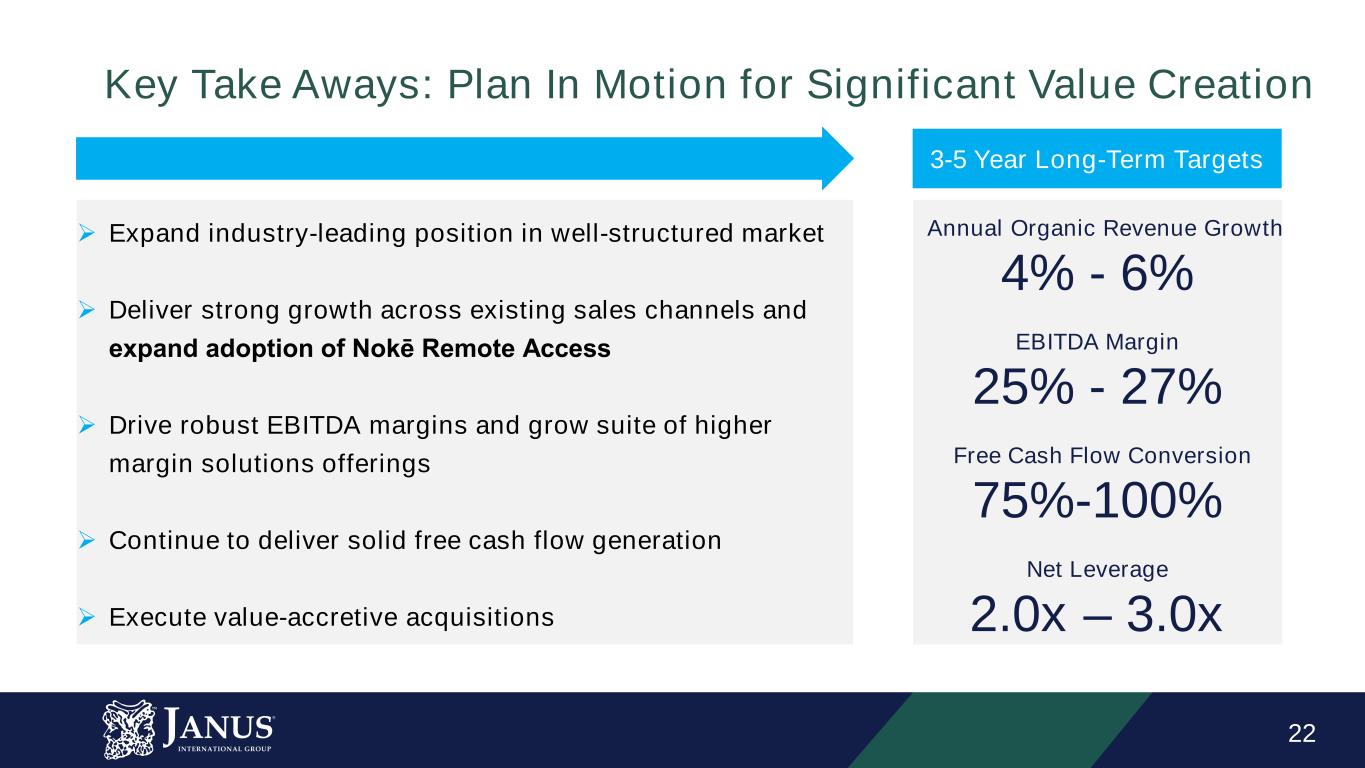
22 3-5 Year Long-Term Targets Key Take Aways: Plan In Motion for Significant Value Creation Annual Organic Revenue Growth 4% - 6% EBITDA Margin 25% - 27% Net Leverage 2.0x – 3.0x Free Cash Flow Conversion 75%-100% Expand industry-leading position in well-structured market Deliver strong growth across existing sales channels and expand adoption of Nokē Remote Access Drive robust EBITDA margins and grow suite of higher margin solutions offerings Continue to deliver solid free cash flow generation Execute value-accretive acquisitions
23 APPENDIX A Supplemental Materials Appendix
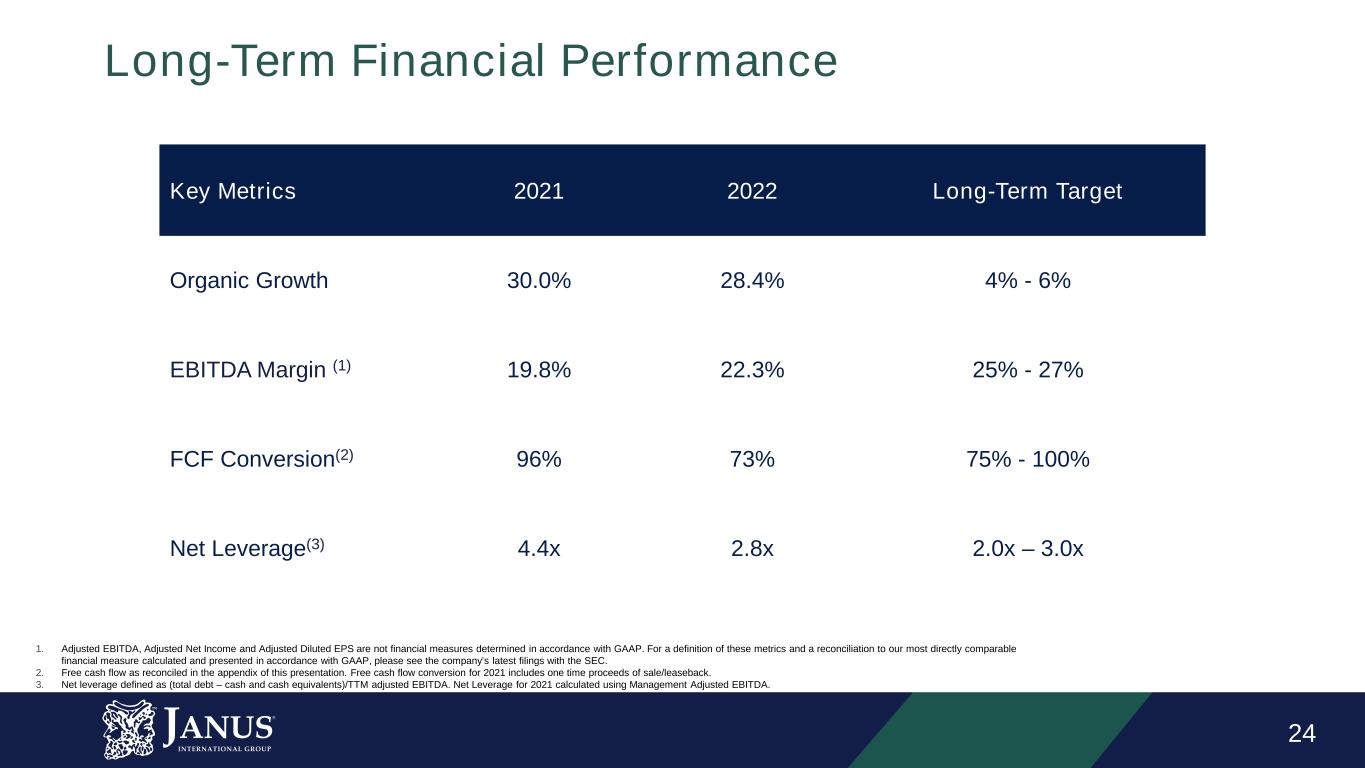
24 Long-Term Financial Performance Key Metrics 2021 2022 Long-Term Target Organic Growth 30.0% 28.4% 4% - 6% EBITDA Margin (1) 19.8% 22.3% 25% - 27% FCF Conversion(2) 96% 73% 75% - 100% Net Leverage(3) 4.4x 2.8x 2.0x – 3.0x 1. Adjusted EBITDA, Adjusted Net Income and Adjusted Diluted EPS are not financial measures determined in accordance with GAAP. For a definition of these metrics and a reconciliation to our most directly comparable financial measure calculated and presented in accordance with GAAP, please see the company’s latest filings with the SEC. 2. Free cash flow as reconciled in the appendix of this presentation. Free cash flow conversion for 2021 includes one time proceeds of sale/leaseback. 3. Net leverage defined as (total debt – cash and cash equivalents)/TTM adjusted EBITDA. Net Leverage for 2021 calculated using Management Adjusted EBITDA.
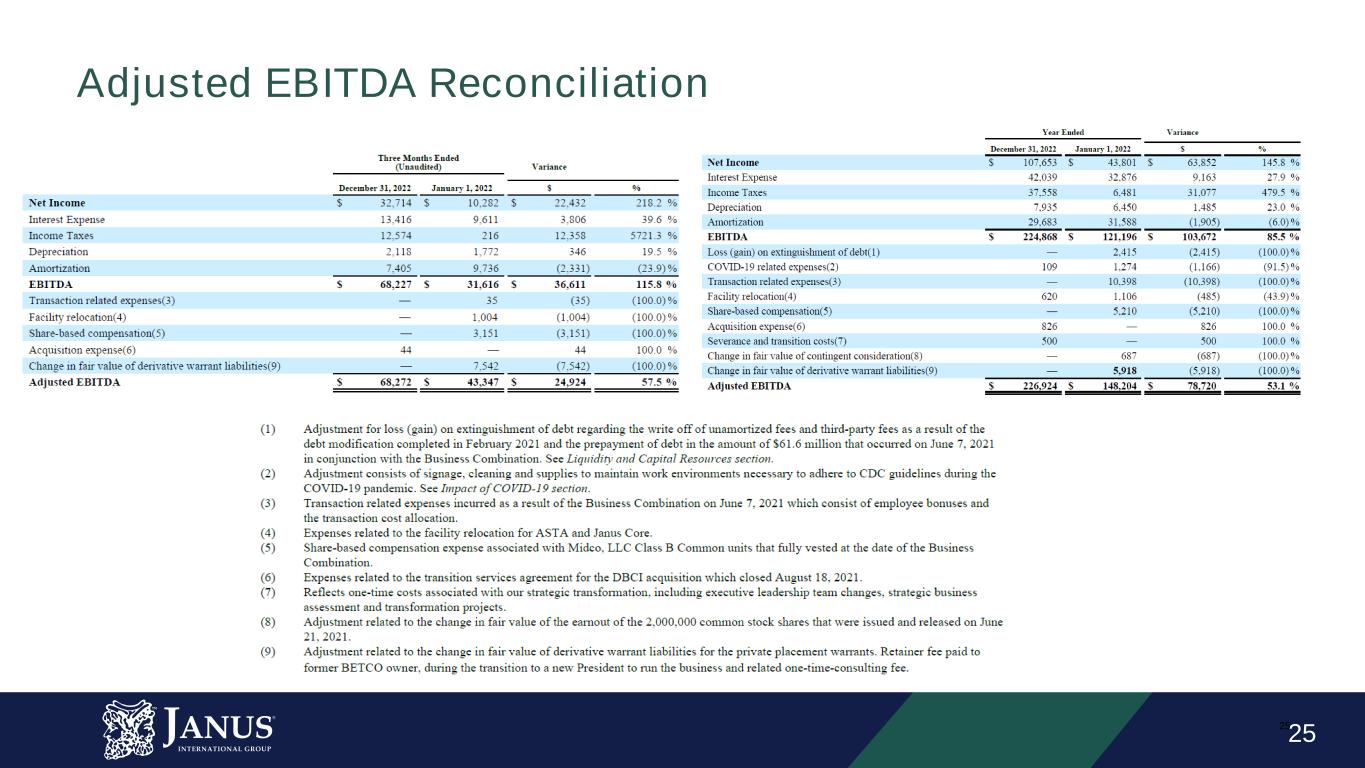
2525 Adjusted EBITDA Reconciliation
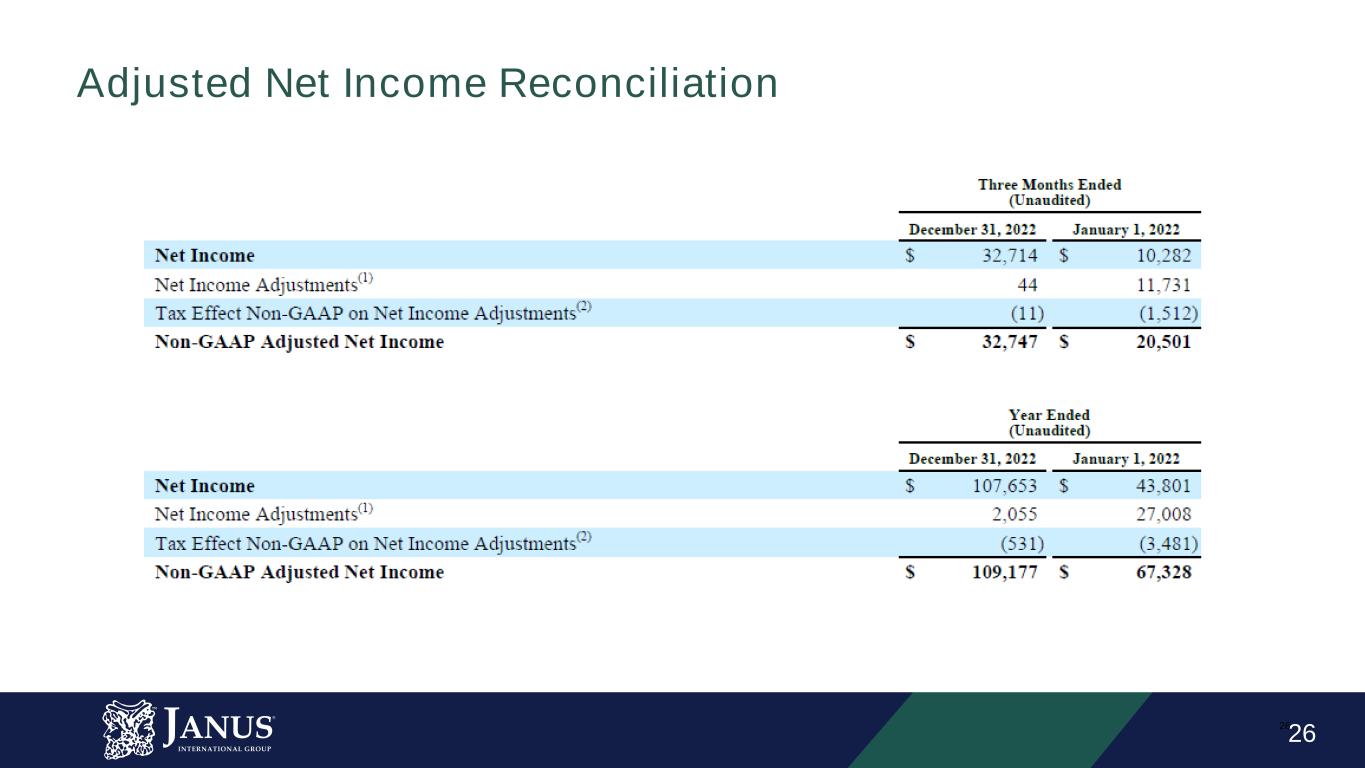
2626 Adjusted Net Income Reconciliation
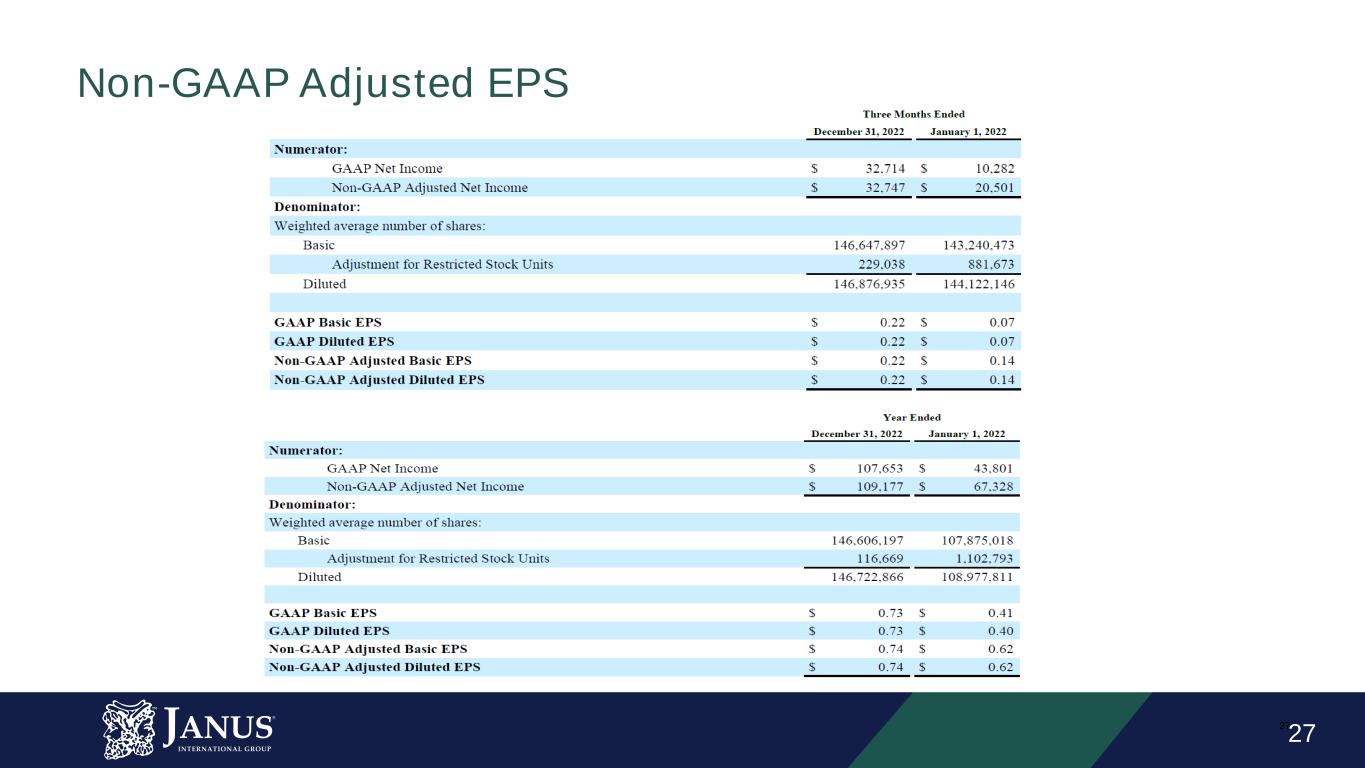
2727 Non-GAAP Adjusted EPS
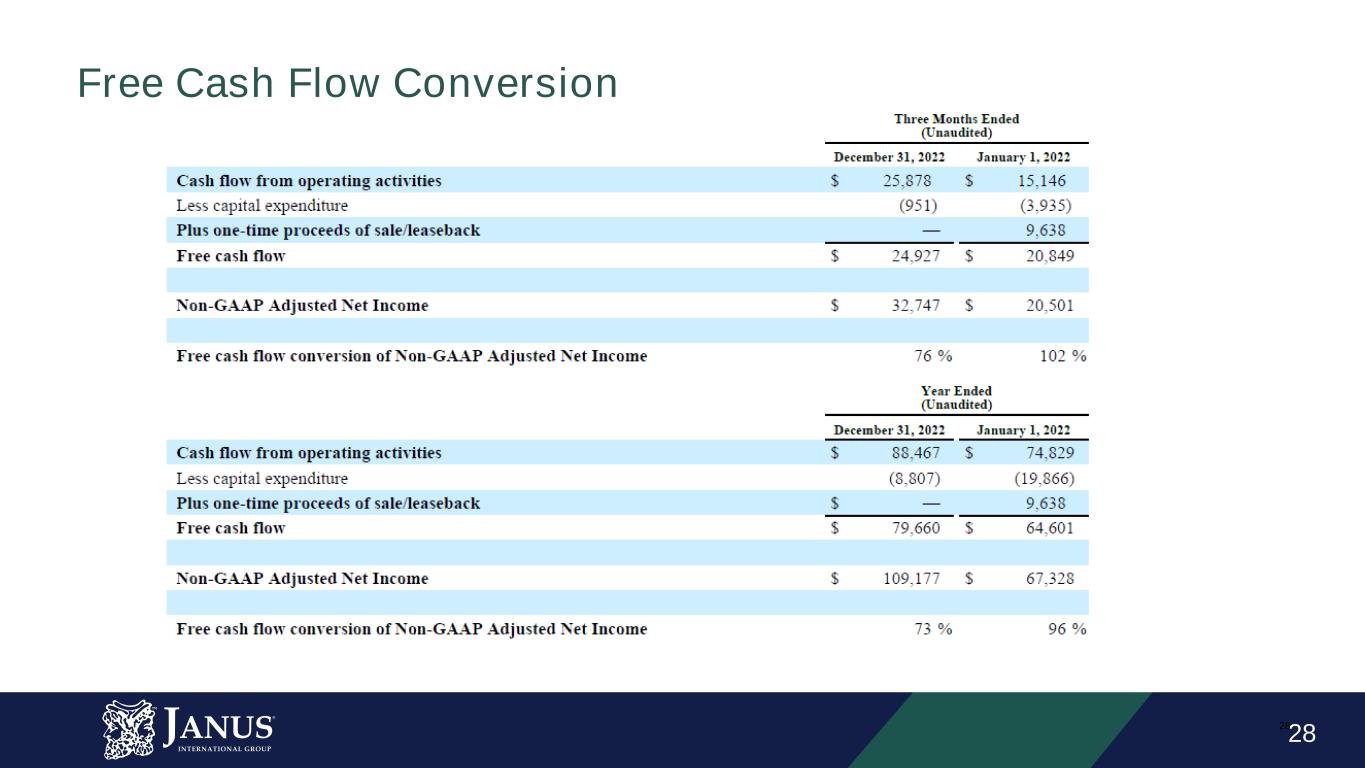
2828 Free Cash Flow Conversion